本文档主要用于配合sysapp包实现V10嵌入式多模终端模块定制功能,主要说明如何将需要安装的deb包下载到一个特定系统,然后制作成该系统的本地apt源,最终实现在无需联网的情况下可自由安装、卸载本地源中的包,并自动解决依赖关系。
指定本地仓库地址
新建"/etc/apt/sources.list.d/sysapp-local.list" APT源配置文件,指定"/opt/sysapp/repo"为本地仓库地址
内容如下(注意最内层目录需要空格分开):
deb [trusted=yes] file:/opt/sysapp repo/
将需要安装的deb包和依赖下载到本地目录
可以先在一个带有外网源的系统上一次下载完所有包,然后再拷贝到本地
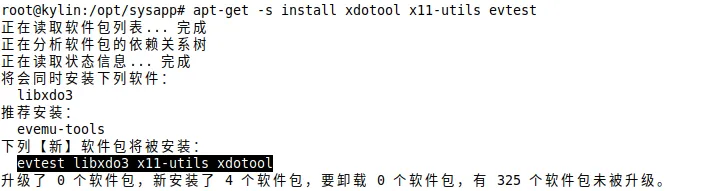
模拟安装所需包(获取实际需要下载的包)
apt-get -s install xdotool x11-utils evtest
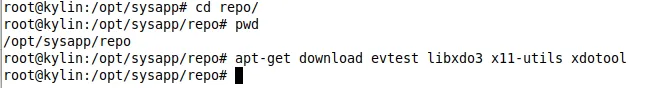
根据2.1的输出结果下载所需包到本地仓库
apt-get download evtest libxdo3 x11-utils xdotool
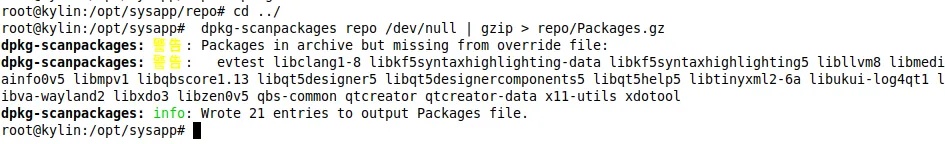
扫描本地仓库,生成仓库索引信息
dpkg-scanpackages repo /dev/null | gzip > repo/Packages.gz
更新系统仓库缓存
apt-get update
指定本地仓库优先级
新建"/etc/apt/preferences.d/sysapp-local.pref" APT源优先级配置文件,指定本地仓库地址优先级为2000
内容如下:
Package: *

Pin: origin ""

Pin-Priority: 2000
验证
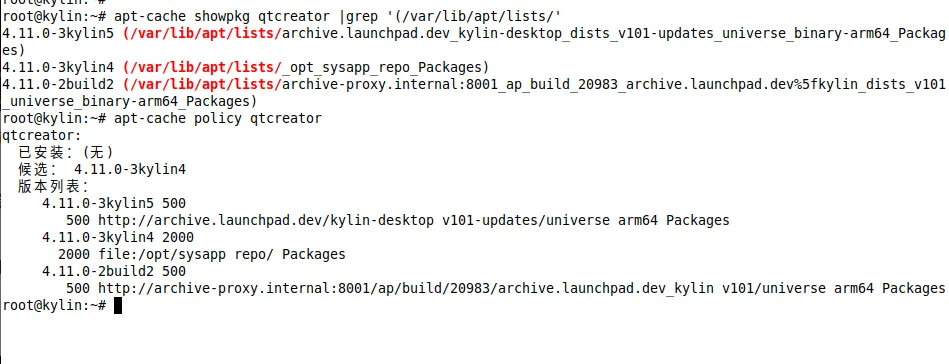
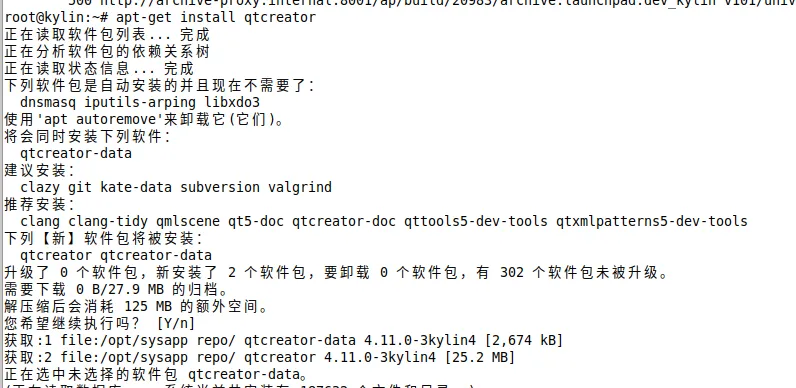
查看特定deb的缓存版本
如下可以看到qtcreator共3个版本,其中最新的版本为4.11.0-3kylin5, 优先级为500, 本地源版本为4.11.0-3-kylin4, 优先级为2000
安装
可以看到,即使本地源中的版本不是最新的但由于优先级更高还是安装了本地源中的版本
补充说明
链接
https://www.jianshu.com/p/3abea53e4d66
RK平台有一个2D加速器,名字叫做RGA,其主要用来做图片处理的加速,在适配RK3588平台的过程中,有发现一些主板上播放适配卡顿或者不播放。从而定位到是RGA的MMU无法访问4G以上的内存地址空间导致。经排查,通过在ffmpeg中申请4G以内的dma buffer来绕过RGA的硬件缺陷,本文章分享此问题的解题过程
一:问题现象
在使用ffplay播放视频的时候,会出现如下问题
[ 719.046159] rga2 fdb80000.rga: swiotlb buffer is full (sz: 278528 bytes), total 32768 (slots), used 591 (slots)
[ 719.047045] rga_dma_buf: Failed to map src attachment
[ 719.047491] rga_mm: rga_mm_map_dma_buffer core[4] map dma buffer error!
[ 719.048090] rga_mm: rga_mm_map_buffer map dma_buf error!
[ 719.048556] rga_mm: job buffer map failed!
[ 719.048914] rga_mm: src channel map job buffer failed!
[ 719.048915] rga_job: rga_job_run: failed to map buffer
[ 719.049996] rga_job: some error on rga_job_run before hw start, rga_job_next(343)
[ 719.050652] rga_job: some error on job, rga_job_commit(668)
[ 719.051140] rga_job: failed to commit job!
[ 719.051509] rga: rga_request_commit failed
将内核升级后,得到如下错误
Nov 24 14:14:35 Kylin kernel: [85438.014740] rga_mm: RGA_MMU unsupported Memory larger than 4G!
Nov 24 14:14:35 Kylin kernel: [85438.014772] rga_mm: scheduler core[4] unsupported mm_flag[0x0]!
Nov 24 14:14:35 Kylin kernel: [85438.014848] rga_mm: rga_mm_map_buffer iommu_map virtual address error!
Nov 24 14:14:35 Kylin kernel: [85438.014859] rga_mm: job buffer map failed!
Nov 24 14:14:35 Kylin kernel: [85438.014869] rga_mm: dst channel map job buffer failed!
Nov 24 14:14:35 Kylin kernel: [85438.014878] rga_mm: failed to map buffer
Nov 24 14:14:35 Kylin kernel: [85438.014894] rga_job: rga_job_commit: failed to map job info
Nov 24 14:14:35 Kylin kernel: [85438.014969] rga_job: request[1] task[0] job_commit failed.
Nov 24 14:14:35 Kylin kernel: [85438.014981] rga_job: rga request commit failed!
Nov 24 14:14:35 Kylin kernel: [85438.014992] rga: request[1] submit failed!
从而导致3588上播放视频性能低下
二:分析
2.1 根据日志简单解析
从日志 Failed to map src attachment 可以看定位代码地址
drivers/video/rockchip/rga3/rga_dma_buf.c
sgt = dma_buf_map_attachment(attach, dir);
 if (IS_ERR(sgt)) {
 pr_err("Failed to map src attachment\n");
 ret = -EINVAL;
 goto err_get_sgt;
 }
并且通过日志 RGA_MMU unsupported Memory larger than 4G 可以发现RGA MMU确实存在此硬件问题
2.2 跟踪ffplay代码
ffplay为ffmpeg的播放测试程序,视频经过ffplay播放,会通过libavcodec做真正的硬解码动作,其代码位置为 libavcodec/rkmppdec.c
经过定位
if (avctx->pix_fmt != AV_PIX_FMT_DRM_PRIME) {
 ret = rkmpp_convert_frame(avctx, frame, mppframe, buffer);
 goto out;
 }
这里判断了pix fmt类型,如果不是DRM_PRIME类型,则主动通过mpp进行帧的转换
avctx->pix_fmt = ff_get_format(avctx, avctx->codec->pix_fmts);
帧格式通过ffmpeg的api获取
这里默认会拿到YCbCr_420_SP的视频格式,但是AV_PIX_FMT_DRM_PRIME默认格式为RK_FORMAT_YCbCr_420_P。所以视频过来的每一帧都需要进行 420sp-→420p的格式转换
这个转换通过两种方式,如果rga不支持,则通过软件转换,如下
for (i = 0; i < frame->height / 2; i++) {
 for (j = 0; j < frame->width; j++) {
 dst_u[j] = src[2 * j + 0];
 dst_v[j] = src[2 * j + 1];
 }
 dst_u += u_pitch;
 dst_v += v_pitch;
 src += hstride;
 }
如果rga支持,则通过rga的api 加速转换
c_RkRgaBlit(&src_info, &dst_info, NULL)
2.3 基本推断
从上面的信息可以判断,rgaBlit的失败,会导致内核出错,并且每一帧的视频输出格式都通过cpu来计算,从而导致播放卡顿
根据c_RkRgaBlit 的两个参数,结合/usr/include/rga/drmrga.h 的struct rga_info 定义,可以看到 void *virAddr 是rga内部使用的内存地址
根据分析rga源码,从而得到如下为rga内部使用的内存地址
src_info.fd = mpp_buffer_get_fd(buffer);
dst_info.virAddr = dst_y;
2.4 跟踪代码
跟踪mpp的代码可以知道,mpp的buffer通过如下申请
ret = mpp_buffer_group_get_internal(&decoder->frame_group, MPP_BUFFER_TYPE_DRM);
获取mpp源码 mpp_1.5.0-1.tar.gz 分析代码,可以发现
osal/linux/os_allocator.c 的 MPP_RET os_allocator_get(os_allocator *api, MppBufferType type) 作为所有的mpp的buffer的申请器
其支持的申请方式如下:
MPP_BUFFER_TYPE_NORMAL    malloc申请

MPP_BUFFER_TYPE_ION            android的ion申请

MPP_BUFFER_TYPE_DRM           通过drm设备"/dev/dri/card0"申请
这里可以发现,当前版本的mpp内存申请方式,都没有对内存的实际地址进行判断,也就是有可能在rga的mmu访问的时候,实际内存可能大于4G内存
而在内核内,有申请dma32的堆的驱动drivers/dma-buf/heaps/
打开 DMABUF_HEAPS_SYSTEM 重编译内核,替换内核后重启,可以看到dma的申请设备
/dev/dma_heap/system /dev/dma_heap/system-uncached
/dev/dma_heap/system-dma32 /dev/dma_heap/system-uncached-dma32
对应的,要使用dma32,可以借鉴rk的使用例子。代码在linux-rga源码
samples/im2d_slt/sources/dma_alloc.cpp
通过合入patch的方式,可以为mpp增加一个dma heap的内存申请方式。可以参考commit 如下
https://gitlab2.kylin.com/shanghai-team/mpp/-/commit/3ed4d85d6ba174575e7bd0fe0cc6b29f4d54c9ee
2.5 运行测试
将支持dma heap申请的mpp编译后,安装在系统上,进入调试状态,
export mpp_rt_debug=1 && ffplay /data/bbb_sunflower_2160p_60fps_normal.mp4
在另一个窗口监听syslog 如下
tail -f /var/log/syslog | grep mpp_rt
通过日志可以发现,在播放视频时,mpp这边的buffer已经正常的通过heap的方式申请
Nov 24 16:52:38 Kylin mpp[999038]: mpp_rt: use dma heap allocator
通过sysfs也可以看到dma buffer已经申请成功
cat /sys/kernel/debug/dma_buf/bufinfo
04177920 00000002 00080007 00000002 system-uncached-dma32 03377282 1002674-ffplay
 Attached Devices:
 fdc38100.rkvdec-core
Total 1 devices attached
但是MMU 4G的问题还是存在
2.6 rga的dest buffer
至此mpp buffer这边已经正常的通过dma去申请了。而rga这边的buffer还是有问题的,继续翻阅ffmpeg的代码,可以找到
rkmppdec.c

if (avctx->pix_fmt != AV_PIX_FMT_DRM_PRIME) {
 ret = ff_get_buffer(avctx, frame, 0);
 if (ret < 0)
 goto out;
 }
可以发现,rga的dest buffer通过ffmpeg的标准接口申请,跟踪代码可知,内存的申请通过av_malloc
故,为了解决rga这边的内存问题,需要也通过dma去申请
申请如下:
ret = ioctl(buf->fd, DMA_HEAP_IOCTL_ALLOC, buf->alloc_info);
 if (ret < 0) {
 av_log(avctx, AV_LOG_ERROR, "Failed to alloc rga dst dma buffer\n");
 goto out;
 }
 if (fcntl(buf->alloc_info->fd, F_GETFL) & O_RDWR)
 prot |= PROT_WRITE;
 buf->buf_ptr = mmap(NULL, MAX_FRAMESIZE, prot, MAP_SHARED, buf->alloc_info->fd, 0);
 if (buf->buf_ptr == MAP_FAILED) {
 av_log(avctx, AV_LOG_ERROR, "Failed to mmap dma buffer.size=%d: %s\n", MAX_FRAMESIZE, strerror(errno));
 goto out;
 }
由此,可以得到一个buf→buf_ptr 的 MAX_FRAMESIZE (819281924) 的内存地址
然后将此地址提供给每个帧buffer上,如下
 frame->data[0] = decoder->dma_buf->buf_ptr;
 frame->data[1] = frame->data[0] + frame->linesize[0]*mpp_frame_get_ver_stride(mppframe);
 frame->data[2] = frame->data[1] + frame->linesize[1]*mpp_frame_get_ver_stride(mppframe)/2;
此计算是为了满足如下公式
u_pitch == y_pitch / 2
v_pitch == y_pitch / 2
dst_u == dst_y + y_pitch * dst_height
dst_v == dst_u + u_pitch * dst_height / 2
而 frame->data[0] 即 dst_info.virAddr = dst_y;
由此,rga这边的buffer也是dma申请的。
root@kylin:/sys/kernel/debug/dma_buf# cat bufinfo | grep 268435456 -A 3
268435456 00000002 00080007 00000002 system-uncached-dma32 03444815 1029285-ffplay
 Attached Devices:
Total 0 devices attached
这里可以看到 268435456 = MAX_FRAMESIZE 已经正常申请
patch地址为
https://gitlab2.kylin.com/shanghai-team/FFmpeg/-/commit/9fbfadb6f185e73b2140b5ff063ef2445897b301
2.7 权限
ffplay因为要通过dma去申请,这里需要满足权限
需要复制给dma heap 一个777 的最大权限,确保应用正常使用堆
chmod -R 777 /dev/dma_heap/
三:自测结果
通过播放视频,查看rga的使用率,确定rga正常使用,视频播放不卡顿。如下
watch -n 1 cat /sys/kernel/debug/rkrga/load
Every 1.0s: cat /sys/kernel/debug/rkrga/load kylin: Thu Nov 24 17:20:31 2022
num of scheduler = 3
================= load ==================
scheduler[0]: rga3_core0
 load = 0%
-----------------------------------
scheduler[1]: rga3_core1
 load = 0%
-----------------------------------
scheduler[2]: rga2
 load = 22%
-----------------------------------
 process 1: pid = 1033010, name: ffplay /data/bbb_sunflower_2160p_60fps_normal.mp4
这里可以确定,当前视频通过ffplay播放,走的rga2加速。4K的视频源,rga使用率在20-30%。
通常需要一些技巧抓取应用日志,下面列举一下方法抓取一些通用的日志来判断系统问题
一:常用日志方式
显示管理器lightdm	 tail -f /var/log/lightdm/lightdm.log
显示服务器Xorg	 tail -f /var/log/Xorg.0.log
窗口管理器ukui-kwin	 tail -f /home/kylin/.log/ukui_kwin_0.log
系统全局的日志	       tail -f  /var/log/syslog
系统session启动日志	tail -f  /home/kylin/.config/ukui-session/ukui-session-xsmp.log
系统自启动图形的错误日志	tail -f /home/kylin/.xsession-errors
系统启动默认设置的日志	taif -f /home/kylin/.log/usd/MON.log (以日期命名)
应用的系统调用日志	strace -p `pidof XXX`
应用的标准输出日志(未重定向)	tail -f  /proc/`pidof XXX`/fd/2
查看系统统计的日志	journalctl -r
二:找到应用的日志
对于一些应用程序,我们不清楚他在哪里输出了日志,可以使用如下方法来找到应用的日志文件
strace -p `pidof XXX` 2>&1 | grep "openat\|faccessat"
解释一下:这里从系统调用出发,找到进程正在打开和正在准备进入的文件。如果是openat,则日志文件一定存在,如果是faccessat,则日志文件因为权限问题无法写入。
如果应用程序没有日志输出到文件,那么日志只会默认在fd2上,也就是标准输出,如下可以看到日志
tail -f /proc/`pidof XXX`/fd/2
三:Qt的日志
对于Qt的日志,均通过QDebug来实现,但是QDebug并不是都能正常输出,通常我们需要结合《二》,并添加Qt的配置来正常打开qDebug输出。方法如下:
1,判断源码文件是否打开QDebug
确定源文件是否有 #include ,如果没有,qDebug不会输出
2, 判断代码编译是否有宏QT_DEBUG
如果编译过程中,出现宏QT_NO_DEBUG,则代码qDebug并不会输出。则需要修改源码pro文件或cmakefile或makefile等,设置编译为debug,或者手动添加QT_DEBUG宏,例如:
CONFIG(debug ,debug|release){
 DEFINES -= QT_NO_DEBUG_OUTPUT
}else{
 DEFINES += QT_NO_DEBUG_OUTPUT
}
这里设置去掉宏QT_NO_DEBUG_OUTPUT,当然直接打开QT_DEBUG宏也可以
3, 判断日志到文件还是标准输出
确定代码是否使用 qInstallMessageHandler。如使用,日志默认到文件,如未使用,日志默认到标准输出
确定方法如上述第二章节
4, 日志过滤
一些Qt使用了QLoggingCategory来管理日志,对应的qt日志api的日志并不会显示,这时候需要配置环境变量来打开日志。如下
export QT_LOGGING_RULES="*.debug=true;qt.*.debug=false"
当然,可以按照自己的规则来过滤,主要参考代码。例如ukui-kwin可以如下:
export QT_LOGGING_RULES="kwin_libinput*=true;"
这样可以看到kwin相关libinput的日志
5,已有工程的qDebug日志
/usr/share/glib-2.0/schemas/org.ukui.log4qt.gschema.xml
修改为false 和 DEBUG 和 DEBUG,daily
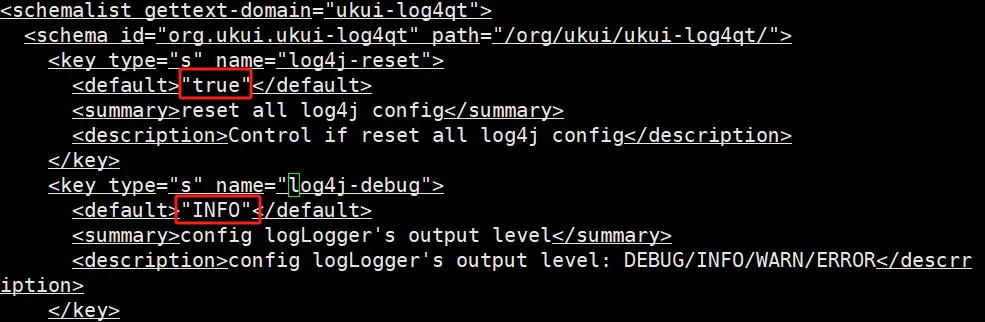
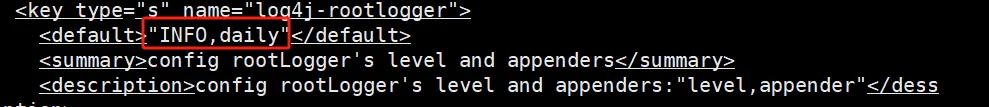
修改后,重编译glib schemas即可
glib-compile-schemas /usr/share/glib-2.0/schemas/
四:全局日志
因为Qt的日志太过复杂,我们通常在release版本上调试代码,但是反复修改配置太累,为了让调试日志更加容易,可以使用syslog,它简单好用,用完随即可删。主要使用步骤如下:
先在代码中引入syslog头文件
#include <syslog,h>
如果为了日志单独使用一个文件,可以如下,否则默认日志文件在/var/log/syslog
void openlog (char*ident, int option, int facility);
设置日志等级
#define LOG_EMERG 0 /* system is unusable */
#define LOG_ALERT 1 /* action must be taken immediately */
#define LOG_CRIT 2 /* critical conditions */
#define LOG_ERR 3 /* error conditions */
#define LOG_WARNING 4 /* warning conditions */
#define LOG_NOTICE 5 /* normal but significant condition */
#define LOG_INFO 6 /* informational */
#define LOG_DEBUG 7 /* debug-level messages */
打印
syslog(LOG_DEBUG, "[%s] xxxx failed", __func__);
抓
tail -f /var/log/syslog
在Linux系统中,strace命令是一个集诊断、调试、统计与一体的工具,可用来追踪调试程序,能够与其他命令搭配使用,接下来就Linux系统调用工具strace的使用方法和实践给大家做个详细介绍,一起来了解下strace的操作实例吧。
一、场景
1、在操作系统运维中会出现程序或系统命令运行失败,通过报错和日志无法定位问题根因。
2、如何在没有内核或程序代码的情况下查看系统调用的过程。
说明
1、strace是有用的诊断,说明和调试工具,Linux系统管理员可以在不需要源代码的情况下即可跟踪系统的调用。
2、strace显示有关进程的系统调用的信息,这可以帮助确定一个程序使用的哪个函数,当然在系统出现问题时可以使用 strace定位系统调用过程中失败的原因,这是定位系统问题的很好的方法。
参数解析
strace安装方法:
# apt-get install strace –y
strace的常用参数及示例
-c
统计每一系统调用的所执行的时间,次数和出错的次数等。
示例:打印执行uptime时系统系统调用的时间、次数、出错次数和syscall
# strace -c uptime
-d
显示有关标准错误的strace本身的一些调试输出。
-f
跟踪子进程,这些子进程是由于fork(2)系统调用而由当前跟踪的进程创建的。
-i
在系统调用时打印指令指针。
-t
跟踪的每一行都以时间为前缀。
-tt
如果给出两次,则打印时间将包括微秒。
-ttt
如果给定三次,则打印时间将包括微秒,并且前导部分将打印为自该XX以来的秒数。
-T
显示花费在系统调用上的时间。这将记录每个系统调用的开始和结束之间的时间差。
-v
打印环境,统计信息,termios等调用的未缩写版本。这些结构在调用中非常常见,因此默认行为显示了结构成员的合理子集。使用此选项可获取所有详细信息。
-V
打印strace的版本号。
-e expr
限定表达式,用于修改要跟踪的事件或如何跟踪它们:
-e trace=set
仅跟踪指定的系统调用集。该-c选项用于确定哪些系统调用可能是跟踪有用有用。例如,trace=open,close,read,write表示仅跟踪这四个系统调用。
-e trace=file
跟踪所有以文件名作为参数的系统调用。
示例:打印执行ls时跟文件有关的系统调用。
# strace -e trace=file ls
-e trace=process
跟踪涉及过程管理的所有系统调用。这对于观察进程的派生,等待和执行步骤很有用。
-e trace=network
跟踪所有与网络相关的系统调用。
-e trace=signal
跟踪所有与信号相关的系统调用。
-e trace=ipc
跟踪所有与IPC相关的系统调用。
-o 文件名
将跟踪输出写入文件名而不是stderr。
-p pid
使用进程ID pid附加到该进程并开始跟踪。跟踪可以随时通过键盘中断信号(CTRL -C)终止。
-S
按指定条件对-c选项打印的直方图输出进行排序。
示例:打印执行uname系统调用中calls的次数排序
# strace -fc -S calls uname
注:其他参数可以查看man手册
# man strace
使用实践
以“定位一次系统无法解析域名故障”为例
问题现象
无法访问外网域名,提示Name or service not know。
且已检查系统DNS配置文件/etc/resolv.conf正确,排除DNS解析失败。
问题分析
当前无法确定系统在执行 解析域名失败的原因,这时候需要使用strace查看系统调用过程,域名解析通常跟系统读取文件相关,因此我们只查看open file的过程。具体命令如下:
# strace -e strace=open ping www.baidu.com
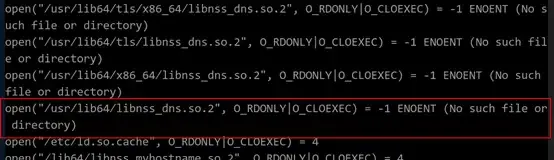
如上图所示在系统调用过程中出现/usr/lib64/libnss_dns.so.2文件缺失,则问题根因已确定为libnss_dns.so.2系统库文件缺失。
解决方法:
libnss_dns.so.2文件由glibc dev包产生,因此重新安装该包即可,请执行
一、前言
在音频开发中,窗体多半为半透明、圆角窗体,如下为Qt 5.5 VS2013实现半透明方法总结。
二、半透明方法设置
2.1 窗体及子控件都设置为半透明
-
setWindowOpacity(0.8);//参数范围为0-1.0,通过QSlider控件做成透明度控制条 -
无边框设置
setWindowFlags(Qt::FramelessWindowHint); -
窗体圆角设置
setAttribute(Qt::WA_TranslucentBackground);
  通过paintEvent绘制窗体背景色与圆角
  void Widget::paintEvent(QPaintEvent *event)
  {
    QPainter painter(this);
    painter.setRenderHint(QPainter::Antialiasing); // 反锯齿;
    painter.setBrush(QBrush(QColor("#616F76")));  //窗体背景色
    painter.setPen(Qt::transparent);
    QRect rect = this->rect();        //rect为绘制大小
    rect.setWidth(rect.width() - 1);
    rect.setHeight(rect.height() - 1);
    painter.drawRoundedRect(rect, 15, 15);  //15为圆角角度
    //也可用QPainterPath 绘制代替 painter.drawRoundedRect(rect, 15, 15);
    //QPainterPath painterPath;
    //painterPath.addRoundedRect(rect, 15, 15);//15为圆角角度
    //painter.drawPath(painterPath);
    QWidget::paintEvent(event);
  }
2.2、通过图片贴图,设置局部透明
- 窗体设置
setAttribute(Qt::WA_TranslucentBackground);//背景半透明属性设置
setWindowFlags(Qt::FramelessWindowHint);//无边框窗体设置
- 采用样式加载图片
ui->m_BgWidget->setStyleSheet("background-image:url(:/images/bg.png);");
注意:m_BgWidget为窗体对象的子窗体,不能直接设置QWidget
- 效果图如下

2.3 通过paintEvent重绘背景色透明度
- 窗体属性设置
setAttribute(Qt::WA_TranslucentBackground);//背景半透明属性设置
  setWindowFlags(Qt::FramelessWindowHint);//无边框窗体设置
  m_BgColor = QColor("#616F76");//默认背景色
  m_BgColor.setAlphaF(0.8);
  this->setContextMenuPolicy(Qt::CustomContextMenu);
  connect(this, SIGNAL(customContextMenuRequested(const QPoint &)),
      this, SLOT(showContextMenuSlot(const QPoint &)));//右击出现菜单
- 右击出现菜单
void Widget::showContextMenuSlot(const QPoint &pos)
  {
    QAction *act = NULL;
    if(NULL == m_Menu)
    {
      m_Menu = new QMenu();//菜单
      m_Actions.clear();//记录所有Action
      act = m_Menu->addAction("1.0", this, SLOT(funcSlot()));
      m_Actions << act;
      act->setCheckable(true);
      act = m_Menu->addAction("0.8", this, SLOT(funcSlot()));
      m_Actions << act;
      act->setCheckable(true);  //设置可选中
      act->setChecked(true);  //设置被选中
      act = m_Menu->addAction("0.5", this, SLOT(funcSlot()));
      m_Actions << act;
      act->setCheckable(true);
      act = m_Menu->addAction("0.3", this, SLOT(funcSlot()));
      m_Actions << act;
      act->setCheckable(true);
      act = m_Menu->addAction("0.1", this, SLOT(funcSlot()));
      m_Actions << act;
      act->setCheckable(true);
    }
    m_Menu->exec(mapToGlobal(pos));//弹出菜单
  }
- 选择菜单Action,修改背景颜色透明度
void Widget::funcSlot()
  {
    QAction *act = qobject_cast<QAction *>(sender());//获取选中的Action
    if(act)
    {
      double alpha = act->text().toDouble();
      m_BgColor.setAlphaF(alpha);//背景色透明度修改
      foreach(QAction *action, m_Actions)//去除其余选中,互斥
      {
        if(act != action)
          action->setChecked(false);
      }
      this->update();//刷新界面
    }
  }
- 通过paintEvent重绘背景色
void Widget::paintEvent(QPaintEvent *event)
  {
    QPainter painter(this);
    painter.setRenderHint(QPainter::Antialiasing); // 反锯齿;
    painter.setBrush(QBrush(m_BgColor));//修改后的背景色
    painter.setPen(Qt::transparent);
    QRect rect = this->rect();      //rect为绘制窗体大小
    rect.setWidth(rect.width() - 1);
    rect.setHeight(rect.height() - 1);
    painter.drawRoundedRect(rect, 15, 15);//15为圆角角度
    //也可用QPainterPath 绘制代替 painter.drawRoundedRect(rect, 15, 15);
    //QPainterPath painterPath;
    //painterPath.addRoundedRect(rect, 15, 15);
    //painter.drawPath(painterPath);
    QWidget::paintEvent(event);
  }
-
效果如下

2.4 通过paintEvent采用Clear模式绘图,实现局部透明
- 窗体属性设置
m_Margin = 60;//各个绘制图形与边框的距离
  m_BgColor = QColor("#00BFFF");//窗体背景色
  installEventFilter(this);//事件过滤器,用于鼠标按下后界面移动
  setWindowFlags(Qt::FramelessWindowHint);//无边框窗体设置
  setAttribute(Qt::WA_TranslucentBackground);//背景半透明属性设置
- 画笔属性设置
void Widget::paintEvent(QPaintEvent *)
  {
    QPainter painter(this);
    painter.setPen(Qt::NoPen);
    painter.setBrush(m_BgColor);
    painter.drawRoundedRect(this->rect(), 15, 15);//设置整体窗体圆角为15°
    painter.setCompositionMode(QPainter::CompositionMode_Clear);//设置Clear绘图模式
    //绘制三角形
    drawTriangle(&painter);
    //绘制圆
    drawCircular(&painter);
    //绘制矩形
    drawRectangle(&painter);
  }
- 绘制三角形
void Widget::drawTriangle(QPainter *painter)
  {
    QPainterPath path;
    int width = this->width() / 2;
    int height = this->height() / 2;
    //顶点
    int topX = width / 2;
    int topY = m_Margin;
    //左下顶点
    int leftX = m_Margin;
    int leftY = height - m_Margin;
    //右下顶点
    int rightX = width - m_Margin;
    int rightY = height - m_Margin;
    path.moveTo(topX, topY);//起点
    path.lineTo(leftX, leftY);//画线段1
    path.lineTo(rightX, rightY);//画线段2
    path.lineTo(topX, topY);//画线段3
    painter->fillPath(path, QBrush(m_BgColor));//绘制三角形
  }
- 绘制圆
void Widget::drawCircular(QPainter *painter)
  {
    int width = this->width() / 2;
    int height = this->height() / 2;
    int x = width + width / 2;//X向坐标
    int y = height / 2; //Y向坐标
    int r = width / 2 - m_Margin;
    //第一个参数为中心点,r为x向、y向长度(不一致时可绘制椭圆)
    painter->drawEllipse(QPoint(x, y), r, r);
  }
- 绘制矩形
void Widget::drawRectangle(QPainter *painter)
  {
    int width = this->width() / 2;
    int height = this->height() / 2;
    int rectWidth = width - 2 * m_Margin;//矩形宽度
    int rectHeight = height - 2 * m_Margin;//矩形高度
    int rectX = width - rectWidth / 2;//矩形X向长度
    int rectY = height + m_Margin;//矩形Y向长度
    painter->drawRect(QRect(rectX, rectY, rectWidth, rectHeight));
  }
-
运行效果