目录
为了调试内核,我们经常会使用kprobe来调试程序,目前的kprobe挂在了ftrace框架下,所以我们有必要讲一下kprobe/kretprobe,它非常有助于我们调试内核。本文以一个例子来展示kprobe/kretprobe的使用,从而让大家具备调试内核的基本能力
一、什么是KPROBE/KRETPROBE
kprobe是能够动态的进入内核收集函数基本信息的工具,它通过替换指令的方式替换指令的方式,将原本运行在某函数的栈跳到了kprobe的栈,故kprobe能够收集函数的入参,调用栈等基本信息
而kretprobe是改进的kprobe,顾名思义,它可以用于获取函数的返回值信息
所以,kprobe/kretprobe能够获取:
- 寄存器地址
- 内核虚拟地址
- 符号地址
- 堆栈
- 入参
- 返回值 根据此,如下描述是我们了解kprobe必须要记住的:
 p[:[GRP/][EVENT]] [MOD:]SYM[+offs]|MEMADDR [FETCHARGS]        : Set a probe
 r[MAXACTIVE][:[GRP/][EVENT]] [MOD:]SYM[+0] [FETCHARGS]        : Set a return probe
 p[:[GRP/][EVENT]] [MOD:]SYM[+0]%return [FETCHARGS]    : Set a return probe
 -:[GRP/][EVENT]                                               : Clear a probe

GRP            : Group name. If omitted, use "kprobes" for it.
EVENT          : Event name. If omitted, the event name is generated
                 based on SYM+offs or MEMADDR.
MOD            : Module name which has given SYM.
SYM[+offs]     : Symbol+offset where the probe is inserted.
SYM%return     : Return address of the symbol
MEMADDR        : Address where the probe is inserted.
MAXACTIVE      : Maximum number of instances of the specified function that
                 can be probed simultaneously, or 0 for the default value
                 as defined in Documentation/trace/kprobes.rst section 1.3.1.

FETCHARGS      : Arguments. Each probe can have up to 128 args.
 %REG          : Fetch register REG
 @ADDR         : Fetch memory at ADDR (ADDR should be in kernel)
 @SYM[+|-offs] : Fetch memory at SYM +|- offs (SYM should be a data symbol)
 $stackN       : Fetch Nth entry of stack (N >= 0)
 $stack        : Fetch stack address.
 $argN         : Fetch the Nth function argument. (N >= 1) (\*1)
 $retval       : Fetch return value.(\*2)
 $comm         : Fetch current task comm.
 +|-[u]OFFS(FETCHARG) : Fetch memory at FETCHARG +|- OFFS address.(\*3)(\*4)
 \IMM          : Store an immediate value to the argument.
 NAME=FETCHARG : Set NAME as the argument name of FETCHARG.
 FETCHARG:TYPE : Set TYPE as the type of FETCHARG. Currently, basic types
                 (u8/u16/u32/u64/s8/s16/s32/s64), hexadecimal types
                 (x8/x16/x32/x64), VFS layer common type(%pd/%pD), "char",
                 "string", "ustring", "symbol", "symstr" and bitfield are
                 supported.

 (\*1) only for the probe on function entry (offs == 0). Note, this argument access
       is best effort, because depending on the argument type, it may be passed on
       the stack. But this only support the arguments via registers.
 (\*2) only for return probe. Note that this is also best effort. Depending on the
       return value type, it might be passed via a pair of registers. But this only
       accesses one register.
 (\*3) this is useful for fetching a field of data structures.
 (\*4) "u" means user-space dereference. See :ref:`user_mem_access`.
上面的描述,大家可以看看,具体内容直接试试即可。
1.1 相关文件
为了能够正常操作kprobe,我们关注如下几个文件:
/sys/kernel/debug/tracing/kprobe_events
/sys/kernel/debug/tracing/events/kprobes
/sys/kernel/debug/kprobes/list
这三个文件分别为:
- kprobe事件触发器
- kprobe详细事件
- 打开的kprobe列表
二、示例
这里直接以系统调用open为例,方便大家理解
2.1 kprobe监听系统所有的openat事件
我们知道一个open事件对应内核是do_sys_openat2,所以查看声明如下:
static long do_sys_openat2(int dfd, const char __user *filename, struct open_how *how)
基于此,我们直接打印arg2即可,这里是char *,我们可以通过string打印,如下
echo 'p:kylin do_sys_openat2 filename=+0($arg2):string' > /sys/kernel/debug/tracing/kprobe_events
然后打开trace信息如下:
echo 1 > events/kprobes/kylin/enable
此时日志如下:
 systemd-journal-311 [003] d... 394.007790: kylin: (do_sys_openat2+0x0/0x2d0) filename="/run/log/journal/150c911f73834975b41af71e80344144/system.journal"
 systemd-journal-311 [003] d... 394.576585: kylin: (do_sys_openat2+0x0/0x2d0) filename="/run/log/journal/150c911f73834975b41af71e80344144/system.journal"
 systemd-journal-311 [003] d... 394.576798: kylin: (do_sys_openat2+0x0/0x2d0) filename="/run/log/journal/150c911f73834975b41af71e80344144/system.journal"
如果无需继续trace,关闭方法如下:
echo 0 > /sys/kernel/debug/tracing/events/kprobes/kylin/enable
echo > /sys/kernel/debug/tracing/kprobe_events
2.2 kretprobe监听系统所有的openat事件
我们知道系统所有的openat系统调用到内核都是调用的do_sys_openat2,而在do_sys_openat2中存在getname函数,其函数声明如下:
struct filename *getname(const char __user *);
此函数返回一个struct filename,而这个结构如下:
struct filename {
 const char *name; /* pointer to actual string */
 const __user char *uptr; /* original userland pointer */
 int refcnt;
 struct audit_names *aname;
 const char iname[];
};
所以我们可以编写kprobe_events如下:
echo 'r:kprobes/kylin getname arg1=+0($retval):string[1]' > kprobe_events
这里值得注意的是 string[1]的编写,可以参考如下:
The string array type is a bit different from other types. For other base types, <base-type>[1] is equal to <base-type> (e.g. +0(%di):x32[1] is same as +0(%di):x32.)
But string[1] is not equal to string. The string type itself represents “char array”, but string array type represents “char * array”.
So, for example, +0(%di):string[1] is equal to +0(+0(%di)):string. Bitfield is another special type, which takes 3 parameters, bit-width, bit- offset, and container-size (usually 32).
The syntax is:
b<bit-width>@<bit-offset>/<container-size>
所以我们直接拿到了char* name字段。此时我们打开kprobe即可,如下:
echo 1 > /sys/kernel/debug/tracing/events/kprobes/kylin/enable
然后我们直接读取ftrace的pipe即可
cat /sys/kernel/tracing/trace_pipe
我截取了一部分输出,以systemd的journal 服务,可以发现如下日志
 systemd-journal-308 [001] d... 58935.290005: kylin: (do_sys_openat2+0x18c/0x2d0 <- getname) arg1={"/run/log/journal/150c911f73834975b41af71e80344144/system.journal"}
 systemd-journal-308 [001] d... 58935.290339: kylin: (do_sys_openat2+0x18c/0x2d0 <- getname) arg1={"/run/log/journal/150c911f73834975b41af71e80344144/system.journal"}
 systemd-journal-308 [001] d... 58935.290542: kylin: (do_sys_openat2+0x18c/0x2d0 <- getname) arg1={"/run/log/journal/150c911f73834975b41af71e80344144/system.journal"}
 systemd-journal-308 [001] d... 58935.290740: kylin: (do_sys_openat2+0x18c/0x2d0 <- getname) arg1={"/run/log/journal/150c911f73834975b41af71e80344144/system.journal"}
这里直接打印了openat的name字段是/run/log/journal/150c911f73834975b41af71e80344144/system.journal
三、总结
至此,我从如何使用上解释了kprobe和kretprobe,相信大家具备基于kprobe的调试基本能力了,如果需要了解原文的,可以查看如下:
https://www.kernel.org/doc/html/latest/trace/kprobetrace.html
https://www.kernel.org/doc/html/latest/trace/kprobes.html
如果大家还想深入的,可以查看如下文章:
An introduction to KProbes [LWN.net]
https://lwn.net/Articles/132196/
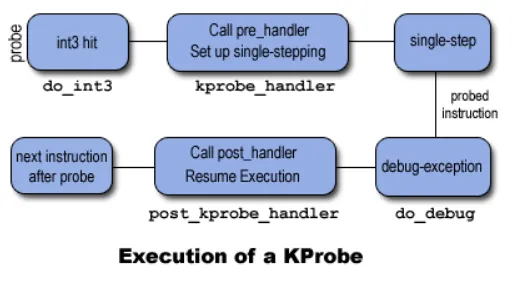
图示如下: