目录
为了调测和学习linux kernel,我们可以使用kgdb,关于kgdb一直没有相关文档,最近有同事产生疑问,故基于rk3399的经验上,在rk3588上尝试使用kgdb来进行内核调试
一、什么是kgdb
我相信大家都了解gdb,用gdb来调试linux 内核,在内核的实现叫做kgdb,kgdb需要host和target两台机器,并且只能通过串口。对于想要进一步了解的,可以查看如下文章,文章内容不多
https://www.kernel.org/pub/linux/kernel/people/jwessel/kgdb/ch01.html
二、内核配置kgdb
为了内核打开kgdb,我们需要配置如下:
CONFIG_KGDB
CONFIG_KGDB_SERIAL_CONSOLE
CONFIG_KALLSYMS
这样,我们在启动后内核就有如下参数配置项
/sys/module/kgdboc/parameters/kgdboc
我们知道rk的tty叫做ttyFIQ0,所以我们可以设置kgdb管理此tty,如下:
echo ttyFIQ0 > /sys/module/kgdboc/parameters/kgdboc
此时我们主动触发linux进入debug模式即可,如下:
echo g > /proc/sysrq-trigger
然后关闭串口即可
三、arm64主机配置
为了能够使用kgdb,我们需要有一台arm64的机器,我这里是飞腾笔记本。
3.1 sshfs
通常,我们的代码放在了服务器,而我们笔记本如果想访问不是很方便,所以我们要借助sshfs来映射,如下:
mkdir ~/sshfs
sshfs root@172.25.130.130:/root/public-workspace/tf/01-3588-x11/squashfs-root/root/kernel/ ~/sshfs
这样我们就能在主机上访问内核代码
3.2 gdb
这里值得注意的是,我们默认的gdb工具不支持1500000的波特率,所以我们需要重新编译gdb工具,补丁如下:
From 78d16865df671f80da8d0a97b18596ef8a3feae3 Mon Sep 17 00:00:00 2001
From: Dan Callaghan <dan.callaghan@morsemicro.com>
Date: Mon, 8 May 2023 18:29:45 +1000
Subject: [PATCH] Support higher baud rates when they are defined

On Linux at least, baud rate codes are defined up to B4000000. Allow the
user to select them if they are present in the system headers.

Change-Id: I393ff32e4a4b6127bdf97e3306ad5b6ebf7c934e
---
 gdb/ser-unix.c | 66 ++++++++++++++++++++++++++++++++++++++++++++++++++
 1 file changed, 66 insertions(+)

diff --git a/gdb/ser-unix.c b/gdb/ser-unix.c
index ede2a58308a..cdc0cf98b7b 100644
--- a/gdb/ser-unix.c
+++ b/gdb/ser-unix.c
@@ -327,6 +327,72 @@ baudtab[] =
     460800, B460800
   }
   ,
+#endif
+#ifdef B500000
+  {
+    500000, B500000
+  }
+  ,
+#endif
+#ifdef B576000
+  {
+    576000, B576000
+  }
+  ,
+#endif
+#ifdef B921600
+  {
+    921600, B921600
+  }
+  ,
+#endif
+#ifdef B1000000
+  {
+    1000000, B1000000
+  }
+  ,
+#endif
+#ifdef B1152000
+  {
+    1152000, B1152000
+  }
+  ,
+#endif
+#ifdef B1500000
+  {
+    1500000, B1500000
+  }
+  ,
+#endif
+#ifdef B2000000
+  {
+    2000000, B2000000
+  }
+  ,
+#endif
+#ifdef B2500000
+  {
+    2500000, B2500000
+  }
+  ,
+#endif
+#ifdef B3000000
+  {
+    3000000, B3000000
+  }
+  ,
+#endif
+#ifdef B3500000
+  {
+    3500000, B3500000
+  }
+  ,
+#endif
+#ifdef B4000000
+  {
+    4000000, B4000000
+  }
+  ,
 #endif
   {
     -1, -1
此补丁来源gdb上游,如下地址,大家自行合并即可
https://gitlab.com/gnutools/binutils-gdb/-/commit/78d16865df671f80da8d0a97b18596ef8a3feae3
这样我们将gdb拉起sshfs的vmlinux如下:
gdb vmlinux
由于我们的内核配置波特率是1500000,和默认的115200不一致,我们需要单独设置,如下:
set serial baud 1500000
然后直接连接连接kgdb的target即可,如下:
target remote /dev/ttyUSB0
这样我们就正常的kgdb调试linux kernel了。
(gdb) target remote /dev/ttyUSB0
Remote debugging using /dev/ttyUSB0
arch_kgdb_breakpoint () at ./arch/arm64/include/asm/kgdb.h:21
21 asm ("brk %0" : : "I" (KGDB_COMPILED_DBG_BRK_IMM));
3.3 el1_irq异常
关于kgdb的正常使用,有一笔patch一直没办法合入,主要原因是step调试如果禁用中断了,本身就相当于修改了内核行为,它是不应该的,关于具体的内容,可以查看如下:
https://patchwork.kernel.org/project/linux-arm-kernel/patch/20170523043058.5463-3-takahiro.akashi@linaro.org/
关于此讨论,主要是如下补丁:
root@kylin:~/sshfs/kernel# git diff arch/arm64/kernel/kgdb.c
diff --git a/arch/arm64/kernel/kgdb.c b/arch/arm64/kernel/kgdb.c
index e4e95821b1f6..932b0d9d592f 100644
--- a/arch/arm64/kernel/kgdb.c
+++ b/arch/arm64/kernel/kgdb.c
@@ -15,10 +15,13 @@
 #include <linux/kprobes.h>
 #include <linux/sched/task_stack.h>

+#include <asm/ptrace.h>
 #include <asm/debug-monitors.h>
 #include <asm/insn.h>
 #include <asm/traps.h>

+static DEFINE_PER_CPU(unsigned int, kgdb_pstate);
+
 struct dbg_reg_def_t dbg_reg_def[DBG_MAX_REG_NUM] = {
        { "x0", 8, offsetof(struct pt_regs, regs[0])},
        { "x1", 8, offsetof(struct pt_regs, regs[1])},
@@ -206,6 +209,10 @@ int kgdb_arch_handle_exception(int exception_vector, int signo,
                err = 0;
                break;
        case 's':
+               /* mask interrupts while single stepping */
+               __this_cpu_write(kgdb_pstate, linux_regs->pstate);
+               linux_regs->pstate |= PSR_I_BIT;
+
                /*
                 * Update step address value with address passed
                 * with step packet.
@@ -251,9 +258,18 @@ NOKPROBE_SYMBOL(kgdb_compiled_brk_fn);

 static int kgdb_step_brk_fn(struct pt_regs *regs, unsigned int esr)
 {
+       unsigned int pstate;
+
        if (!kgdb_single_step)
                return DBG_HOOK_ERROR;

+       /* restore interrupt mask status */
+       pstate = __this_cpu_read(kgdb_pstate);
+       if (pstate & PSR_I_BIT)
+               regs->pstate |= PSR_I_BIT;
+       else
+               regs->pstate &= ~PSR_I_BIT;
+
        kgdb_handle_exception(0, SIGTRAP, 0, regs);
        return DBG_HOOK_HANDLED;
 }
上面代码很容易理解,我们知道AARCH64有PSSTATE寄存器
armv8_arm_v8.6.pdf
D1.7 Process state, PSTATE .................................................................................. D1-2330
这里描述如下:
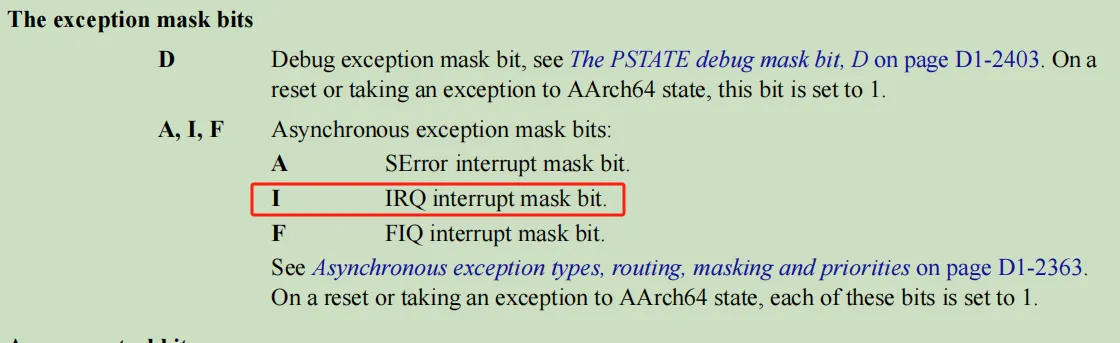 这里简单直接的在step的时候禁用了IRQ。
这里我们为了gdb能够step调试,能够承担这样的风险,所以合并了这个patch。
四、基本演示
当一切准备好了之后,我们直接看到如下信息:
# gdb vmlinux
GNU gdb (Kylin 9.1-0kylin1) 9.1
Copyright (C) 2020 Free Software Foundation, Inc.
License GPLv3+: GNU GPL version 3 or later <http://gnu.org/licenses/gpl.html>
This is free software: you are free to change and redistribute it.
There is NO WARRANTY, to the extent permitted by law.
Type "show copying" and "show warranty" for details.
This GDB was configured as "aarch64-linux-gnu".
Type "show configuration" for configuration details.
For bug reporting instructions, please see:
<http://www.gnu.org/software/gdb/bugs/>.
Find the GDB manual and other documentation resources online at:
 <http://www.gnu.org/software/gdb/documentation/>.
For help, type "help".
Type "apropos word" to search for commands related to "word"...
Reading symbols from vmlinux...
(gdb) set serial baud 1500000
(gdb) target remote /dev/ttyUSB0
Remote debugging using /dev/ttyUSB0
arch_kgdb_breakpoint () at ./arch/arm64/include/asm/kgdb.h:21
21 asm ("brk %0" : : "I" (KGDB_COMPILED_DBG_BRK_IMM));
(gdb)
这里以我常用的do_sys_openat2为例子,如下:

(gdb) b do_sys_openat2
Breakpoint 1 at 0xffffffc0082c78e0: do_sys_openat2. (2 locations)
(gdb) c
Continuing.
[Switching to Thread 669]
Thread 238 hit Breakpoint 1, 0xffffffc0082c78e0 in do_sys_openat2 () at fs/open.c:1098
1098 if (flags & O_DIRECTORY)
堆栈如下:
(gdb) bt
#0 0xffffffc0082c78e0 in do_sys_openat2 () at fs/open.c:1098
#1 0xffffffc0082c7e7c in do_sys_open (mode=<optimized out>, flags=<optimized out>, filename=<optimized out>, dfd=<optimized out>) at fs/open.c:1002
#2 __do_sys_openat (mode=<optimized out>, flags=<optimized out>, filename=<optimized out>, dfd=<optimized out>) at fs/open.c:1249
#3 __se_sys_openat (mode=<optimized out>, flags=<optimized out>, filename=<optimized out>, dfd=<optimized out>) at fs/open.c:1244
#4 __arm64_sys_openat (regs=<optimized out>) at fs/open.c:1244
#5 0xffffffc008026074 in __invoke_syscall (syscall_fn=<optimized out>, regs=0xffffffc00dd4beb0) at arch/arm64/kernel/syscall.c:48
#6 invoke_syscall (syscall_table=0xffffffc009510888 <sys_call_table>, sc_nr=449, scno=<optimized out>, regs=0xffffffc00dd4beb0) at arch/arm64/kernel/syscall.c:48
#7 el0_svc_common (regs=0xffffffc00dd4beb0, scno=<optimized out>, syscall_table=0xffffffc009510888 <sys_call_table>, sc_nr=449) at arch/arm64/kernel/syscall.c:155
#8 0xffffffc0080261a0 in do_el0_svc (regs=<optimized out>) at arch/arm64/kernel/syscall.c:194
#9 0xffffffc0094eea70 in el0_svc (regs=0xffffffc00dd4beb0) at arch/arm64/kernel/entry-common.c:357
#10 0xffffffc0094eefbc in el0_sync_handler (regs=<optimized out>) at arch/arm64/kernel/entry-common.c:373
#11 0xffffffc008011e18 in el0_sync () at arch/arm64/kernel/entry.S:788
Backtrace stopped: Cannot access memory at address 0xffffffc00dd4c0c8
这里可以看到很多optimized out,可能和内核默认的O2有关系,这里就没有演示把内核编译成O1了。
这里我们step一下看看,如下:
(gdb) s
Thread 238 hit Breakpoint 1, do_sys_openat2 (dfd=-100, filename=0x55580b8700 <error: Cannot access memory at address 0x55580b8700>, how=how@entry=0xffffffc00dd4bdf8) at fs/open.c:1203
1203 {
可以看到这里信息一切准确。
我们看看汇编和代码
(gdb) disassemble
Dump of assembler code for function do_sys_openat2:
=> 0xffffffc0082c78e0 <+0>: mov x9, x30
 0xffffffc0082c78e4 <+4>: nop
 0xffffffc0082c78e8 <+0>: stp x29, x30, [sp, #-80]!
 0xffffffc0082c78ec <+4>: mov x29, sp
 0xffffffc0082c78f0 <+8>: stp x19, x20, [sp, #16]
 0xffffffc0082c78f4 <+12>: mrs x20, sp_el0
 0xffffffc0082c78f8 <+16>: mov x19, x2
 0xffffffc0082c78fc <+20>: stp x21, x22, [sp, #32]
 0xffffffc0082c7900 <+24>: mov x21, x1
 0xffffffc0082c7904 <+28>: mov w22, w0
 0xffffffc0082c7908 <+32>: ldr x1, [x20, #1344]
 0xffffffc0082c790c <+36>: str x1, [sp, #72]
 0xffffffc0082c7910 <+40>: mov x1, #0x0 // #0
 0xffffffc0082c7914 <+44>: mov x0, x2
 0xffffffc0082c7918 <+48>: add x1, sp, #0x34
 0xffffffc0082c791c <+52>: bl 0xffffffc0082c7740 <build_open_flags>
 0xffffffc0082c7920 <+56>: cbz w0, 0xffffffc0082c794c <do_sys_openat2+100>
 0xffffffc0082c7924 <+60>: sxtw x0, w0
 0xffffffc0082c7928 <+64>: add x20, x20, #0x540
 0xffffffc0082c792c <+68>: ldr x2, [sp, #72]
 0xffffffc0082c7930 <+72>: ldr x1, [x20]
 0xffffffc0082c7934 <+76>: eor x1, x2, x1
 0xffffffc0082c7938 <+80>: cbnz x1, 0xffffffc0082c7a34 <do_sys_openat2+332>
 0xffffffc0082c793c <+84>: ldp x19, x20, [sp, #16]
 0xffffffc0082c7940 <+88>: ldp x21, x22, [sp, #32]
 0xffffffc0082c7944 <+92>: ldp x29, x30, [sp], #80
 0xffffffc0082c7948 <+96>: ret
 0xffffffc0082c794c <+100>: mov x0, x21
............
对于代码:
static long do_sys_openat2(int dfd, const char __user *filename,
 struct open_how *how)
{
 struct open_flags op;
 int fd = build_open_flags(how, &op);
 struct filename *tmp;
if (fd)
 return fd;
............