根据之前的介绍,我们了解了edf调度算法,edf调度算法能够在理论上实现cpu利用率100%,也是单核性能最强的调度算法,因为edf算法基于deadline来控制调度的优先级,但是同样的,也是因为edf关于deadline的设计,我们使用这个算法的时候必须对任务的执行时间严格确定,也就是预设的周期内,任务是一定要完成的。如果deadline时间内,任务因为例如io问题导致延迟了,那么就会影响后面所有的任务的调度。从极端角度考虑,可能会导致deadline往后的任务,也就是优先级最低的任务,一直被饿死。
为了改善这个问题,cbs算法基于edf之上做了改进,本文介绍cbs算法
什么是cbs算法
cbs:constant bandwidth server。可以看到说明,cbs严格意义上只算一个服务,它用来改进edf算法,那么cbs支持哪些特性呢,如下:
- 为任务新增一个预算,此预算除以周期就是恒定带宽
- 如果任务的预算耗尽,但是任务没完成,则推迟deadline,降低任务优先级,让其他任务有机会运行
- 如果任务在周期内完成,则在下一个周期中,重新设置预算,重新运行,此预算就是其任务运行时间。
根据上面的描述,我们可以发现,cbs调度算法是一种更柔和的edf算法,如果我们的任务没办法确定固定的执行周期,也就是没办法保证任务在预设的周期内完成,那么edf算法就会像多米诺骨牌一样,一个任务延迟会导致其他所有的任务延迟。这种损坏是灾难性的。而cbs就不一样了,如果一个任务延迟,那么就会将其取消,然后降低其优先级。这样它就不会导致整个调度器上的就绪任务全部推迟。
rtems上的cbs调度算法
上面介绍清楚了cbs调度,它是edf的改进。接下来我们看一下rtems的cbs实现,如下
#define SCHEDULER_CBS_ENTRY_POINTS \
  { \
    _Scheduler_EDF_Initialize,       /* initialize entry point */ \
    _Scheduler_EDF_Schedule,         /* schedule entry point */ \
    _Scheduler_EDF_Yield,            /* yield entry point */ \
    _Scheduler_EDF_Block,            /* block entry point */ \
    _Scheduler_CBS_Unblock,          /* unblock entry point */ \
    _Scheduler_EDF_Update_priority,  /* update priority entry point */ \
    _Scheduler_EDF_Map_priority,     /* map priority entry point */ \
    _Scheduler_EDF_Unmap_priority,   /* unmap priority entry point */ \
    SCHEDULER_DEFAULT_SMP_OPERATIONS \
    _Scheduler_CBS_Node_initialize,  /* node initialize entry point */ \
    _Scheduler_default_Node_destroy, /* node destroy entry point */ \
    _Scheduler_CBS_Release_job,      /* new period of task */ \
    _Scheduler_CBS_Cancel_job,       /* cancel period of task */ \
    _Scheduler_default_Start_idle    /* start idle entry point */ \
    SCHEDULER_DEFAULT_SET_AFFINITY_OPERATION \
  }
可以发现,cbs上对任务的初始化,恢复阻塞,新增任务和取消任务做了改进。 对于调度node的初始化,它新增了一个cbs的结构体,记录任务的deadline和budget,并提供一个当预算超时的函数回调。如下
typedef struct {
  /** Relative deadline of the server. */
  time_t deadline;
  /** Budget (computation time) of the server. */
  time_t budget;
} Scheduler_CBS_Parameters;
typedef struct {
  /**
   * Task id.
   *
   * @note: The current implementation of CBS handles only one task per server.
   */
  rtems_id                 task_id;
  /** Server paramenters. */
  Scheduler_CBS_Parameters parameters;
  /** Callback function invoked when a budget overrun occurs. */
  Scheduler_CBS_Budget_overrun  cbs_budget_overrun;

  /**
   * @brief Indicates if this CBS server is initialized.
   *
   * @see _Scheduler_CBS_Create_server() and _Scheduler_CBS_Destroy_server().
   */
  bool initialized;
} Scheduler_CBS_Server;
对于任务周期的开始,cbs相比于edf仅多做两件事
- 给任务节点设置一个预算
- 将任务的周期设置为deadline优先级节点
对于任务的取消,那么直接取消deadline的优先级节点即可
对于任务的解除阻塞,此实现比较重要,其函数如下
void _Scheduler_CBS_Unblock(
  const Scheduler_Control *scheduler,
  Thread_Control          *the_thread,
  Scheduler_Node          *node
)
{
  Scheduler_CBS_Node   *the_node;
  Scheduler_CBS_Server *serv_info;
  Priority_Control      priority;

  the_node = _Scheduler_CBS_Node_downcast( node );
  serv_info = the_node->cbs_server;
  priority = _Scheduler_Node_get_priority( &the_node->Base.Base );
  priority = SCHEDULER_PRIORITY_PURIFY( priority );

  /*
   * Late unblock rule for deadline-driven tasks. The remaining time to
   * deadline must be sufficient to serve the remaining computation time
   * without increased utilization of this task. It might cause a deadline
   * miss of another task.
   */
  if ( serv_info != NULL && ( priority & SCHEDULER_EDF_PRIO_MSB ) == 0 ) {
    time_t deadline = serv_info->parameters.deadline;
    time_t budget = serv_info->parameters.budget;
    uint32_t deadline_left = the_thread->CPU_budget.available;
    Priority_Control budget_left = priority - _Watchdog_Ticks_since_boot;

    if ( deadline * budget_left > budget * deadline_left ) {
      Thread_queue_Context queue_context;

      /* Put late unblocked task to background until the end of period. */
      _Thread_queue_Context_clear_priority_updates( &queue_context );
      _Scheduler_CBS_Cancel_job(
        scheduler,
        the_thread,
        the_node->deadline_node,
        &queue_context
      );
    }
  }

  _Scheduler_EDF_Unblock( scheduler, the_thread, &the_node->Base.Base );
}
可以看到,当任务从其他阻塞状态恢复到非阻塞状态,也就是加入就绪列表的时候,它会计算四个值
- deadline
- budget
- 剩余的deadline
- 剩余的budget
关于deadline和预算我们知道就是任务的周期和任务的执行事件,对于剩余的deadline和budget,其实就是任务实际运行时:
- 相较于设置的deadline还剩余的时间
- 相较于设置的budget还剩余的预算
那么关键的就是如下判断
if ( deadline * budget_left > budget * deadline_left ) {
我们看到不等式如下
deadline * budget_left > budget * deadline_left
它可以替换成如下
budget_left/deadline_left > budget/deadline
那么其含义就清楚了,那就是剩余的预算除以剩余的deadline的比重如果大于预期的预算除以deadline。那么就需要重设优先级,取消任务了。
再把意思转换一下,就是:
- 如果budget_left占比不变,则deadline_left占比太小,也就是剩余的deadline时间不够,也就是当前任务时间不够宽裕
- 如果deadline_left占比不变,则budget_left占比太大,也就是剩余的预算太大
对于上述的1好理解,如果deadline比重太小了,任务可能就不可控了。那么对于2怎么理解呢?
我们知道,如果任务正常执行,不可能存在剩余的预算除以剩余的deadline的占比反而大。但是在计算机领域,我们存在IO,IO是阻塞的,在IO期间,预算的时间是不被减掉的,也就是说进入unblock的预算时间值,实际上是进入IO之前的预算时间值。那么IO的时间实际上还没有计算进去。此时如果budget_left占比太大,说明任务有一定的风险导致不可控。这就理解清楚情况2了。
那么_Scheduler_CBS_Unblock的逻辑就是,如果剩余的任务占比要比预设的任务占比大,那么调度可能失控,此时将其任务从就绪队列删除,降低其优先级
总结
至此,我们基于edf介绍了cbs调度算法,它是edf算法的改进,当意外出现的时候,它会对失控的任务降低优先级,从而不会导致整个调度失控。
接下来,我会通过示例程序演示此调度器。
根据《GICv3中断简介》我们简单了解了gicv3中断控制器,这里根据《GICv3_Software_Overview_Official_Release_B.pdf》的Programmers’ model 来介绍一下gicv3的组成
整体划分
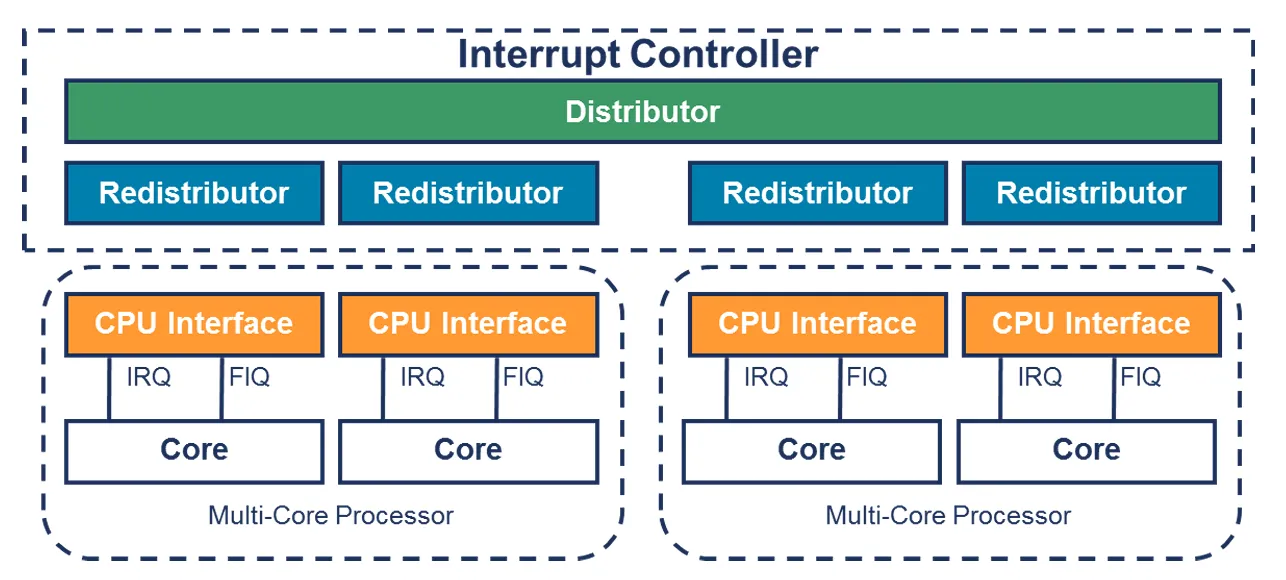
gicv3主要由三大部分组成,如下
- Distributor interface
- Redistributor interface
- CPU interface
这里
- Distributor:它检查中断源的状态,将SGI和SPI这类中断最终派发到到Redistributor上去,因为每个CPU都连接一个Redistributor,所以最终会派发到对应的CPU interface上
- Redistributor:接收Distributor,然后最终将中断发送给CPU Interface
- CPU interface: 就是我们常规理解的中断,它将中断发给CPU,让CPU响应中断
这里Distributor派发到Redistributor是根据优先级的,所以gicv3的affinity hierarchy 图如下
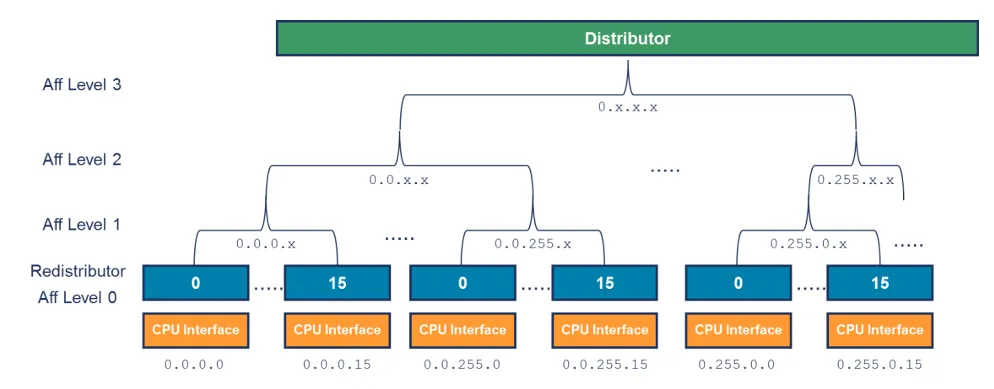
所以,我们知道了gicv3的整体框图如下
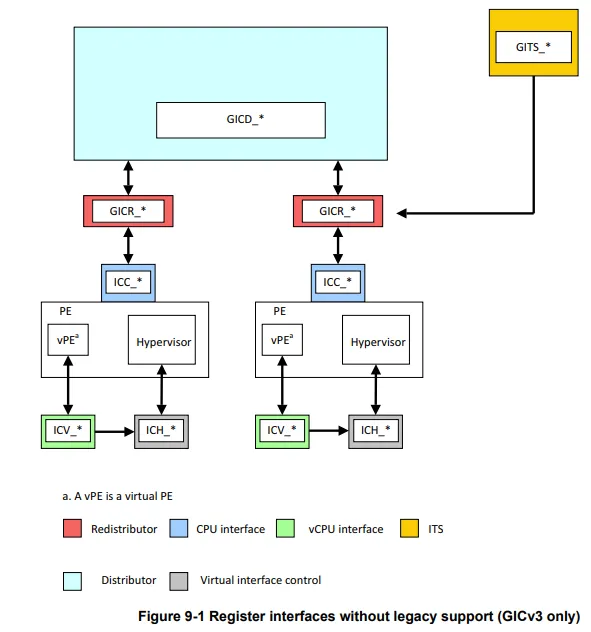
对于寄存器标识,如下
- GICD_* : Distributor,也就是SGI/SPI的分发
- GICR_* : Redistributor,接收中断发给GICC_* ,注意PPI的中断是直接给到GICR_* 不通过GICD_*
- GICC_* : CPU interface, 发送给CPU,响应中断
根据上面的介绍,其实总结一下流程就是如下
- 外设发起中断,发送给distributor
- Distributor将该中断,然后根据优先等级分发给合适的Redistributor
- Redistributor将中断发送给CPU interface。
- CPU interface产生合适的中断异常给处理器
- CPU接收该异常,并且软件处理该中断
其中断状态机如下
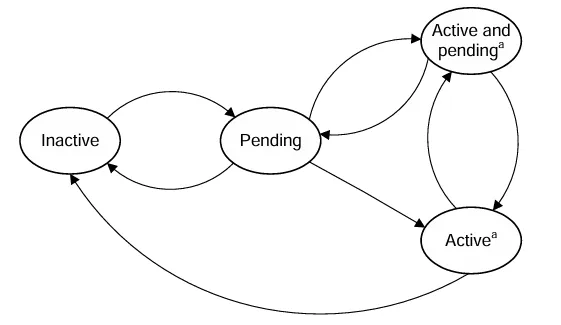
- Inactive: 不活跃状态
- Pending:中断触发了,还没到CPU Interface,还没响应
- Active:被CPU响应和处理
- Active & Pending: (An instance of the interrupt has been acknowledged, and another instance is now pending. )当前有一个中断正在响应,此时有一个相同优先级的中断触发了
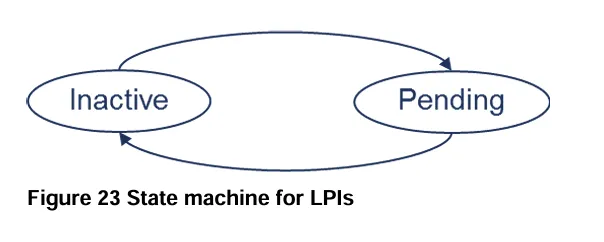
不过LPI中断没有active 或 active and pending 状态,也就是上面的中断状态机只针对SPI,SGI,PPI的。所以LPI的状态机如下
总结
根据上面的信息,我们中间gic-v3的寄存器调用如下图
在《glibc内存malloc简要解析》就介绍了glibc的一些概念,简单来说就是将malloc返回的地址的前16字节叫做chunk header。
在我们操作系统中,遇到了一个非常奇怪的问题,那就是调用xcb的程序,总是在退出的时候,莫名其妙报glibc的错误,包含但不局限于如下
malloc_consolidate(): unaligned fastbin chunk detected
double free or corruption (!prev)
corrupted double-linked list
malloc(): memory corruption
今天介绍这个问题
先看修改
static lazyreply *get_index(xcb_connection_t *c, int idx)
{
    if(c->ext.extensions_size < 0)
        c->ext.extensions_size = 0;

    if(idx > c->ext.extensions_size)
    {
        int new_size = idx << 1;
        lazyreply *new_extensions = realloc(c->ext.extensions, sizeof(lazyreply) * new_size);
        if(!new_extensions)
            return 0;
        memset(new_extensions + c->ext.extensions_size, 0, sizeof(lazyreply) * (new_size - c->ext.extensions_size));
        c->ext.extensions = new_extensions;
        c->ext.extensions_size = new_size;
    }
    return c->ext.extensions + idx - 1;
}
这里对于extensions_size是小于0的情况,强制置0
    if(c->ext.extensions_size < 0)
        c->ext.extensions_size = 0;
我们可以看到get_index的代码,这里会将ext.extensions进行realloc,realloc之后,将新增的大小区域进行memset为0。那么问题就出现在memset上了。
memset(new_extensions + c->ext.extensions_size, 0, sizeof(lazyreply) * (new_size - c->ext.extensions_size));
我们假设extensions_size是-1,那么memset就会清空realloc申请的内存的chunk head结构体。
chunk的数据内容被清空了,那么程序可能正常,也可能在glibc的回收,规整,free,分配等操作中都会出现异常
总结
根据这个问题现象,他是一个非常随机的问题,存在此问题的系统,会给人感觉系统非常不稳定。因为xcb的应用只要运行,就会随机出错,或者大概率退出的时候出错。而且出错的日志全部指向了glibc的内存管理。
而实际上此问题就是对某个内存地址,错误的将chunk head清空了导致的。
定位这个问题也比较困难,我们需要先了解glibc的内存管理相关逻辑,然后gdb找到崩溃现场。根据glibc的逻辑,他是使用双向循环链表来管理每个chunk的bin,所以推荐使用pwndbg工具,这个工具在定位链表上非常方便。
实际上,为了找到xcb的问题,我重编了glibc,mesa,xcb,dri,xorg。甚至我还找rk拿了mali so的符号版本。
同样的,为了前期排查问题,还使用了asan来寻找内存问题。当然,浪费时间了,自己asan学艺不精。
在《一种特殊的栈破坏崩溃问题》中我们根据实际项目遇到的问题总结了一种破坏栈区导致的错误问题,对于此问题,上面文章总有点表述不清楚的感觉,本文基于基本知识点来梳理此问题,其目的是简单易懂的说明这个问题
值传递不超过16字节会使用x0-x7寄存器传值
首先我们需要知道aapcs中的如下表述,我们只需要看B.4
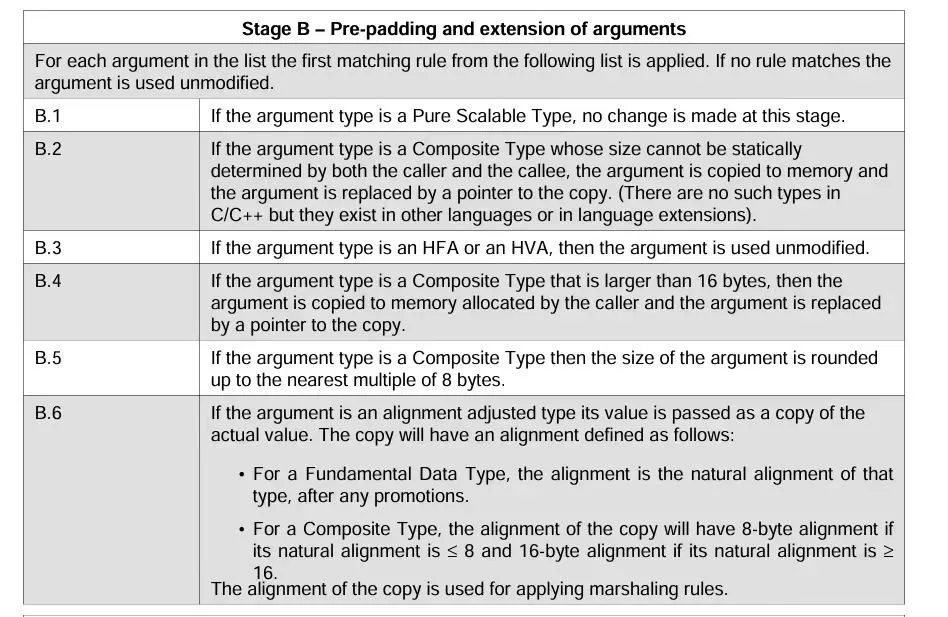
当符合类型超过16字节的时候,aapcs会启用x19保存加载内存的指针。那么此问题要出现,我们原始结构体应该是小于16字节的结构体。
那么需要具备条件的结构体如下
struct kernel{
        int x;
        int y;
        int z;
        int s;
};
aarch64的内存对齐是16字节
我们知道栈的对齐是16字节,实际上,对于值传递寄存器保存的值,也需要16字节对齐。 我们对test函数反汇编,那么如下
In file: /tmp/test.c:33
   28 }
   29
   30 void test(struct kernel k)
   31 {
   32         struct user* s = (struct user*)&k;
 ► 33         s->o4 = 3;
   34         test1(s);
   35         return ;
   36 }
   37
   38 int main(int argc, char *argv[])
───────────────────────────────────────────────────────────────────────────────────────[ STACK ]───────────────────────────────────────────────────────────────────────────────────────
00:0000│ x29 sp 0x7ffffff2f0 —▸ 0x7ffffff320 —▸ 0x7ffffff380 ◂— 0
01:0008│        0x7ffffff2f8 —▸ 0x4006e8 (main+108) ◂— mov w0, #0
02:0010│ x0     0x7ffffff300 ◂— 0x20000000b /* '\x0b' */
03:0018│        0x7ffffff308 ◂— 3
04:0020│        0x7ffffff310 ◂— 1
05:0028│        0x7ffffff318 —▸ 0x7ffffff300 ◂— 0x20000000b /* '\x0b' */
06:0030│        0x7ffffff320 —▸ 0x7ffffff380 ◂— 0
我们看到栈顶是0x7ffffff2f0,那么先保存x29和x30之后,其他剩下的寄存器需要保存值的起始地址应该是0x7ffffff300
所以,我们知道k变量的默认地址在0x7ffffff300,因为k的大小是16字节,那么0x7ffffff310应该就是下一个局部变量的地址 。0x7ffffff308是k结构体的结束。如果k的结构体不是16字节,那么也会按照16字节对齐到0x7ffffff310地址上
值传递不超过16字节时,默认分配栈区是24字节
但是我们看到的0x7ffffff310并不是下一个局部变量的地址,而0x7ffffff318是下一个局部变量s的地址
这里的原因是,从0x7ffffff310到0x7ffffff318共8个字节。
这里gcc的实现故意在此情况添加了8个字节的padding。
也就是说,默认情况下,值传递不超过16字节时,那么默认分配的栈来保存寄存器值的空间是16+8等于24字节
强制类型转换会错误的操作到栈
我们知道0x7ffffff318的后面是下一个局部变量的分配地址,那么0x7ffffff318就是s的地址。
那么如果正常访问,从k的地址0x7ffffff300开始,只能访问
0x7ffffff300/0x7ffffff304/0x7ffffff308/0x7ffffff30c
那么如果想要访问到0x7ffffff318,那么需要再访问3个4字节,所以,假设强制类型转换为
struct user{
        int x;
        int y;
        int z;
        int s;
        int o1;
        int o2;
        int o3;
};
此时访问s->o3,则会访问到0x7ffffff318地址,而0x7ffffff318地址又是指针s在栈区的地址,那么破坏了s的地址,程序访问出现段错误。
总结
本文更清晰的介绍了这个栈破坏的问题。助于理解