之前我们讲到了elf文件,通过解析elf文件,我们知道了对于关键文件需要保护哪些内容,这里主要针对是关键性文件的完整性校验的了解。
一、完整性计算
根据防破解之-elf文件格式我们知道了数据来源,为了实现关键文件防篡改,我们需要对这些内容进行完整性计算,针对此,我们应该满足下面三点:
- 数据正向计算容易,逆向计算几乎不可能
- 数据计算结果长度固定
- 数据计算不易碰撞
根据上面的要求,结合当前已知的数据结构,我们可以选择hash,并且是单向hash。而常用的单向hash有哪些呢,如下:
- md5
- sha
- sm3
对于此,我们可以如下假设,先定义一个数据源来自于.text
objcopy --dump-section .text=text.bin libhelloworld.so
这里我们提取了text.bin,我们先使用md5进行提取摘要
# md5sum text.bin
2d662e596919c294d7e3f274d75549b6 text.bin
使用sha256进行提取摘要
# openssl dgst -sha256 text.bin
SHA256(text.bin)= 6aaf37f9ef03aa1f06dab8083784a4b50acca524f9cf7476acc52bd23dc118f2
使用sm3进行提取摘要 通过openssl
# openssl dgst -sm3 text.bin
SM3(text.bin)= d0e43ea849949decc4cf8deb557f4cb46f0f560563dc2f0a63f6cbfa5e27de18
至此,基于三种算法的完整性计算方案已经演示
二、md5的碰撞
我们可以知道,md5默认是256bit的摘要提取,但是根据当前的技术状态,md5是能够存在碰撞的,虽然是2^128的概率,如下是碰撞例子:
数据1:
STR1=d131dd02c5e6eec4693d9a0698aff95c2fcab58712467eab4004583eb8fb7f8955ad340609f4b30283e488832571415a085125e8f7cdc99fd91dbdf280373c5bd8823e3156348f5bae6dacd436c919c6dd53e2b487da03fd02396306d248cda0e99f33420f577ee8ce54b67080a80d1ec69821bcb6a8839396f9652b6ff72a70
数据2
STR2=d131dd02c5e6eec4693d9a0698aff95c2fcab50712467eab4004583eb8fb7f8955ad340609f4b30283e4888325f1415a085125e8f7cdc99fd91dbd7280373c5bd8823e3156348f5bae6dacd436c919c6dd53e23487da03fd02396306d248cda0e99f33420f577ee8ce54b67080280d1ec69821bcb6a8839396f965ab6ff72a70
此时我们做一下文本转换
echo $STR1 | xxd -r -p > str1
echo $STR2 | xxd -r -p > str2
此时我们对比一下即可
# md5sum str1 str2
79054025255fb1a26e4bc422aef54eb4 str1
79054025255fb1a26e4bc422aef54eb4 str2
可以看到,上面STR1和STR2进行碰撞了
我们通过hexdump进行转换16进制如下:
hexdump -C str1 > 1
hexdump -C str2 > 2
此时我们对比即可两个str的不同

参考:https://www.mscs.dal.ca/~selinger/md5collision/
故,根据此信息,md5存在碰撞问题,我们可以选择sha或sm3,对于sha,我们通常情况下选择更通用的sha256。
三、最终选择
根据上面我们可以知道,如果我们不在意md5的碰撞问题,那么我们可以选择md5,如果比较在意碰撞,那么我们可以选择更通用的sha256算法
当然sha还提供了其他的信息摘要算法,如下:
# openssl help
Message Digest commands (see the `dgst' command for more details)
blake2b512 blake2s256 gost md4
md5 rmd160 sha1 sha224
sha256 sha3-224 sha3-256 sha3-384
sha3-512 sha384 sha512 sha512-224
sha512-256 shake128 shake256 sm3
这些摘要算法我就不一一演示,对于当前方案,我们只需要知道选择了sha256。后续如果有需求使用sm3,会在重构的时候使用sm3。
对于sha256的原理,我也不了解,需要时间沉淀,这里提供文档,点击即可阅读,有兴趣的可以了解一下
关于演示,这里贴出一个网页,也可以了解一下:
为了让系统的二进制文件避免被破解,我们先需要针对elf文件进行了解,本文以防破解为目的,来简单了解一下elf的组成,如果需要详细了解的,建议阅读《elf.pdf》和《elf-64-gen.pdf》,文件点击即可阅读。理解此文章需要一点elf知识,建议可以先搜索引擎简单了解一下。
一、ELF的结构
这里以网上的图片为例,ELF结构如下:
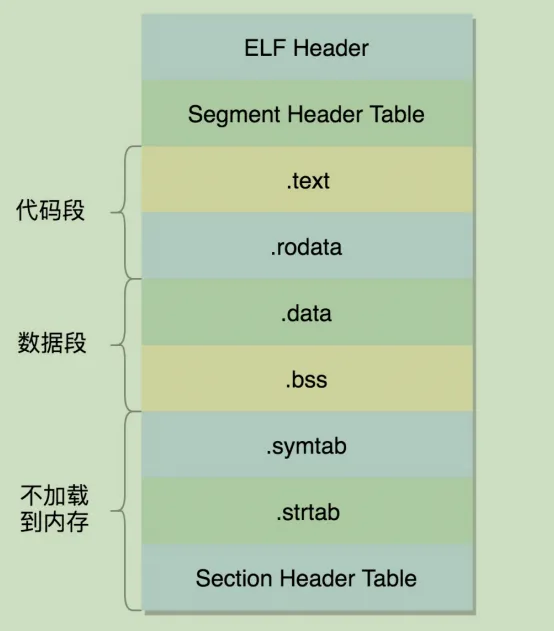 可以发现,这里列举了必要的ELF内容,这里解释如下:
ELF Header: ELF的头结构
.text:  程序的代码段
.rodata: 程序的只读数据区
.data:  程序的已初始化的数据区
.bss: 程序的未初始化数据(初始化为0算未初始化)
.symtab: 链接符号表
.strtab: 字符串表
Section Header:节的头表
而实际上,我以一个helloworld.c的so编译一个libhelloworld.so为例,查看一下elf的结构:
抛开elf头和节头,剩下的段如下:
# readelf -S libhelloworld.so
节头:
  [号] 名称              类型             地址              偏移量
       大小              全体大小          旗标   链接   信息   对齐
  [ 0]                   NULL             0000000000000000  00000000
       0000000000000000  0000000000000000           0     0     0
  [ 1] .note.gnu.build-i NOTE             00000000000001c8  000001c8
       0000000000000024  0000000000000000   A       0     0     4
  [ 2] .gnu.hash         GNU_HASH         00000000000001f0  000001f0
       0000000000000024  0000000000000000   A       3     0     8
  [ 3] .dynsym           DYNSYM           0000000000000218  00000218
       00000000000000d8  0000000000000018   A       4     3     8
  [ 4] .dynstr           STRTAB           00000000000002f0  000002f0
       000000000000007b  0000000000000000   A       0     0     1
  [ 5] .gnu.version      VERSYM           000000000000036c  0000036c
       0000000000000012  0000000000000002   A       3     0     2
  [ 6] .gnu.version_r    VERNEED          0000000000000380  00000380
       0000000000000020  0000000000000000   A       4     1     8
  [ 7] .rela.dyn         RELA             00000000000003a0  000003a0
       00000000000000a8  0000000000000018   A       3     0     8
  [ 8] .rela.plt         RELA             0000000000000448  00000448
       0000000000000048  0000000000000018  AI       3    19     8
  [ 9] .init             PROGBITS         0000000000000490  00000490
       0000000000000014  0000000000000000  AX       0     0     4
  [10] .plt              PROGBITS         00000000000004b0  000004b0
       0000000000000050  0000000000000010  AX       0     0     16
  [11] .text             PROGBITS         0000000000000500  00000500
       00000000000000fc  0000000000000000  AX       0     0     8
  [12] .fini             PROGBITS         00000000000005fc  000005fc
       0000000000000010  0000000000000000  AX       0     0     4
  [13] .eh_frame_hdr     PROGBITS         000000000000060c  0000060c
       0000000000000034  0000000000000000   A       0     0     4
  [14] .eh_frame         PROGBITS         0000000000000640  00000640
       000000000000009c  0000000000000000   A       0     0     8
  [15] .init_array       INIT_ARRAY       0000000000010df0  00000df0
       0000000000000008  0000000000000008  WA       0     0     8
  [16] .fini_array       FINI_ARRAY       0000000000010df8  00000df8
       0000000000000008  0000000000000008  WA       0     0     8
  [17] .dynamic          DYNAMIC          0000000000010e00  00000e00
       00000000000001c0  0000000000000010  WA       4     0     8
  [18] .got              PROGBITS         0000000000010fc0  00000fc0
       0000000000000028  0000000000000008  WA       0     0     8
  [19] .got.plt          PROGBITS         0000000000010fe8  00000fe8
       0000000000000030  0000000000000008  WA       0     0     8
  [20] .data             PROGBITS         0000000000011018  00001018
       0000000000000016  0000000000000000  WA       0     0     8
  [21] .bss              NOBITS           0000000000011030  0000102e
       0000000000000008  0000000000000000  WA       0     0     4
  [22] .comment          PROGBITS         0000000000000000  0000102e
       000000000000002a  0000000000000001  MS       0     0     1
  [23] .symtab           SYMTAB           0000000000000000  00001058
       0000000000000690  0000000000000018          24    64     8
  [24] .strtab           STRTAB           0000000000000000  000016e8
       0000000000000236  0000000000000000           0     0     1
  [25] .shstrtab         STRTAB           0000000000000000  0000191e
       00000000000000e5  0000000000000000           0     0     1
其他的节的解释,可以查看官方文档。这里不做解释了。
二、关注的节
我们带着问题来找答案:目前需要对一个elf文件进行保护,那我们保护什么呢?答案应该如下:
- 代码的实现
- 程序的数据
我们不需要关心的是
- 无需加载到内存中的节
- 参与动态链接的节
- 参与异常处理的节
- 特殊或用于标识的节
这里我们可以知道,下面节是我们无需关心的:
.rela.dyn .rela.plt .plt .got .got.plt
.eh_frame_hdr .eh_frame
.shstrtab .*gnu*
需要关心的是:
.init .init_array .fini .fini_array .text .rodata .data .bss
但是这里我们注意的是32位和64位的.init* 和.fini* 目前没有由程序参与,故可以排除掉,则我们关心如下节即可:
.text .rodata .data .bss
2.1 .text
我们知道.text是二进制的代码段,我们可以通过命令查看如下,以libhelloworld.so为例
# objdump -d -j .text libhelloworld.so

libhelloworld.so:     文件格式 elf64-littleaarch64


Disassembly of section .text:

0000000000000500 <hello_world@@Base-0xd4>:
 500:   90000080        adrp    x0, 10000 <hello_world@@Base+0xfa2c>
 504:   f947ec00        ldr     x0, [x0, #4056]
 508:   b4000040        cbz     x0, 510 <puts@plt+0x20>
 50c:   17fffff5        b       4e0 <__gmon_start__@plt>
 510:   d65f03c0        ret
 514:   d503201f        nop
 518:   b0000080        adrp    x0, 11000 <hello_world@@Base+0x10a2c>
 51c:   9100c000        add     x0, x0, #0x30
 520:   b0000081        adrp    x1, 11000 <hello_world@@Base+0x10a2c>
 524:   9100c021        add     x1, x1, #0x30
 528:   eb00003f        cmp     x1, x0
 52c:   540000c0        b.eq    544 <puts@plt+0x54>  // b.none
 530:   90000081        adrp    x1, 10000 <hello_world@@Base+0xfa2c>
 534:   f947e421        ldr     x1, [x1, #4040]
 538:   b4000061        cbz     x1, 544 <puts@plt+0x54>
 53c:   aa0103f0        mov     x16, x1
 540:   d61f0200        br      x16
 544:   d65f03c0        ret
 548:   b0000080        adrp    x0, 11000 <hello_world@@Base+0x10a2c>
 54c:   9100c000        add     x0, x0, #0x30
 550:   b0000081        adrp    x1, 11000 <hello_world@@Base+0x10a2c>
 554:   9100c021        add     x1, x1, #0x30
 558:   cb000021        sub     x1, x1, x0
 55c:   d37ffc22        lsr     x2, x1, #63
 560:   8b810c41        add     x1, x2, x1, asr #3
 564:   eb8107ff        cmp     xzr, x1, asr #1
 568:   9341fc21        asr     x1, x1, #1
 56c:   540000c0        b.eq    584 <puts@plt+0x94>  // b.none
 570:   90000082        adrp    x2, 10000 <hello_world@@Base+0xfa2c>
 574:   f947f042        ldr     x2, [x2, #4064]
 578:   b4000062        cbz     x2, 584 <puts@plt+0x94>
 57c:   aa0203f0        mov     x16, x2
 580:   d61f0200        br      x16
 584:   d65f03c0        ret
 588:   a9be7bfd        stp     x29, x30, [sp, #-32]!
 58c:   910003fd        mov     x29, sp
 590:   f9000bf3        str     x19, [sp, #16]
 594:   b0000093        adrp    x19, 11000 <hello_world@@Base+0x10a2c>
 598:   3940c260        ldrb    w0, [x19, #48]
 59c:   35000140        cbnz    w0, 5c4 <puts@plt+0xd4>
 5a0:   90000080        adrp    x0, 10000 <hello_world@@Base+0xfa2c>
 5a4:   f947e800        ldr     x0, [x0, #4048]
 5a8:   b4000080        cbz     x0, 5b8 <puts@plt+0xc8>
 5ac:   b0000080        adrp    x0, 11000 <hello_world@@Base+0x10a2c>
 5b0:   f9400c00        ldr     x0, [x0, #24]
 5b4:   97ffffc7        bl      4d0 <__cxa_finalize@plt>
 5b8:   97ffffd8        bl      518 <puts@plt+0x28>
 5bc:   52800020        mov     w0, #0x1                        // #1
 5c0:   3900c260        strb    w0, [x19, #48]
 5c4:   f9400bf3        ldr     x19, [sp, #16]
 5c8:   a8c27bfd        ldp     x29, x30, [sp], #32
 5cc:   d65f03c0        ret
 5d0:   17ffffde        b       548 <puts@plt+0x58>

00000000000005d4 <hello_world@@Base>:
 5d4:   a9be7bfd        stp     x29, x30, [sp, #-32]!
 5d8:   910003fd        mov     x29, sp
 5dc:   52800020        mov     w0, #0x1                        // #1
 5e0:   b9001fe0        str     w0, [sp, #28]
 5e4:   b0000080        adrp    x0, 11000 <hello_world@@Base+0x10a2c>
 5e8:   91008000        add     x0, x0, #0x20
 5ec:   97ffffc1        bl      4f0 <puts@plt>
 5f0:   d503201f        nop
 5f4:   a8c27bfd        ldp     x29, x30, [sp], #32
 5f8:   d65f03c0        ret
2.2 .data
我们知道.data是二进制的已初始化数据段,我们可以通过命令查看如下
# readelf -p .data libhelloworld.so

String dump of section '.data':
  [     8]  Hello, World!
2.3 rodata
我们知道.rodata是二进制的只读数据段,我们需要添加一个变量让其存放在rodata,如下:
const char k[]="Hello, Kylin!";
此时我们查看如下
# readelf -p .rodata libhelloworld.so

String dump of section '.rodata':
  [     0]  Hello, Kylin!
2.4 .bss
我们知道.bss是二进制的未初始化数据段,我们需要添加一个变量让其存放在.bss,如下:
char bss[64] = "";
此时我们查看如下
# objdump -d -j .bss libhelloworld.so

libhelloworld.so:     文件格式 elf64-littleaarch64


Disassembly of section .bss:

0000000000011038 <completed.9189>:
        ...

0000000000011040 <bss>:
        ...
三、如何保护
我们抓住了elf的重点,就是
可加载文件的在运行时加载的text/data/rodata/bss段 如果我们下载hexedit工具,我们只需要对libhelloworld.so进行修改,就能左右代码的执行,数据的信息等等。为了简单易懂,我以修改rodata为例示例修改elf文件。
3.1 制造篡改
假设程序如下:
#include <stdio.h>
void hello_world() {
    const char k[]="Hello, Kylin!";
    printf("%s\n", k);
}
# LD_LIBRARY_PATH=./ ./test-helloworld
Hello, Kylin!
已知rodata的内容是"Hello, Kylin!",我需要通过hexedit修改为"Hello, World!"如下:
hexedit libhelloworld.so
我们知道Hello, World!和Hello, Kylin!的二进制如下
# echo "Hello, World!" | xxd -g 1
00000000: 48 65 6c 6c 6f 2c 20 57 6f 72 6c 64 21 0a        Hello, World!.
# echo "Hello, Kylin!" | xxd -g 1
00000000: 48 65 6c 6c 6f 2c 20 4b 79 6c 69 6e 21 0a        Hello, Kylin!.
这里我们打算把Kylin更换成World,我们使用hexedit编辑即可
hexedit libhelloworld.so
这里我们将4b 79 6c 69 6e修改成57 6f 72 6c 64即可。此时我们再运行程序
# LD_LIBRARY_PATH=./ ./test-helloworld
Hello, World!
3.2 开展保护
为了针对elf程序的修改行为,我们计划是新增一个名字为.encrypt的加密节,里面存放上述关键节的hash加密。关于hash的选择后面文章会提,这里提供添加节的方法如下:
objcopy --add-section .encrypt=sha256_text.bin libhelloworld.so libhelloworld_en.so
此时,这个新的so会多出现一个节,如下:
readelf -S libhelloworld_en.so
[23] .encrypt PROGBITS 0000000000000000 00001058 0000000000000100 0000000000000000 0 0 1
至此,我们根据elf的基本组成原理,为了安全性考量,新增了一个由程序自定义行为(PROGBITS)的节.encrypt来实现对核心文件防篡改的基本需求
为了开发调试方便,这里基于apache2搭建了一个adv的文件上传下载服务器站点,地址是172.25.130.31。本文总结搭建方法,和操作步骤,从而真正意义上实现文件中转站的基本功能
一、为什么要文件中转站
鉴于我们的开发方式是通过服务器上的chroot环境进行开发,而我们的烧录通常是在linux/windows上通过烧录工具的方式,这就导致了我们需要在chroot环境中通过scp的方式将文件复制过来,假设我主机的ip地址是124,那么我需要如下:
scp boot.img root@172.25.80.124:/home/kylin
如果我们的目标ip经常发生改变,那么这个124会经常修改,这就导致我们传输文件比较繁琐。
我们知道,解决任何问题,都可以添加一个中间者,这样,发送者只需要关心发给中间者即可,接受者只需要从中间者接受。
于是文件中转站的角色便诞生了。
二、搭建apache服务器
安装apache2
apt install apache2
使能dav fs
a2enmod dav
a2enmod dav_fs
修改apache2配置
vim /etc/apache2/sites-available/000-default.conf
<VirtualHost *:80>
        ServerAdmin webmaster@localhost
        DocumentRoot /var/www/html/

        Alias /file-hub /root/owner-workspace/file-hub
        <Directory /root/owner-workspace/file-hub>
          Options Indexes FollowSymLinks MultiViews
          AllowOverride None
          Require all granted
          DAV On
          AuthType Basic
          AuthName "WebDAV Restricted Area"
          AuthUserFile /etc/apache2/.htpasswd
          <LimitExcept GET OPTIONS>
              Require valid-user
          </LimitExcept>
            Order allow,deny
            allow from all
          </Directory>

        ErrorLog ${APACHE_LOG_DIR}/error.log
        CustomLog ${APACHE_LOG_DIR}/access.log combined
</VirtualHost>
重启apache2服务
systemctl restart apache2
因为我设置了/root/owner-workspace/file-hub作为我的中转站目录,所以需要使得其具有文件权限
chmod 775 /root
chmod 775 /root/owner-workspace/
chmod 775 /root/owner-workspace/file-hub/
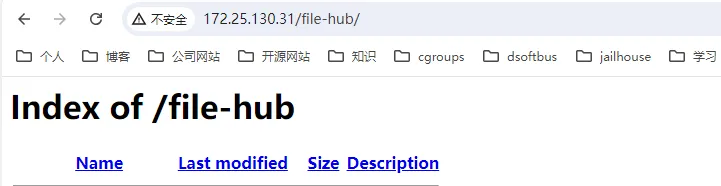
至此,apache服务器已经可以正常使用了,如下所示
三、中转站的上传,下载,删除
对于中转站的上传,下载和删除,可以通过命令如下:
3.1 上传
curl -s -u $USER:$PASSWD -T "{$filename}" "172.25.130.31/file-hub/" -o /dev/null
3.2 下载
curl -O -u $USER:$PASSWD "172.25.130.31/file-hub/$filename"
3.3 删除
curl -X DELETE -u $USER:$PASSWD http://172.25.130.31/file-hub/$filename
3.4 脚本
大家可以根据上面命令的变体,编写upload.sh和download.sh脚本,这样就实现了文件的上传下载,这里给出示范如下:
# upload.sh
USER="root"
PASSWD="Ky1inos"
WEBDEV="dev.kpan.com"

argv=$#

is_dir(){
        if [ -d $1 ]
        then
                for i in `ls $1`
                do
                        is_dir $1/$i
                done
        else
                fn+="$1 "
        fi
}


main(){
        if [ "$argv"x == "0"x ]
        then
                        usage;
                        exit 0
        fi

        # 上传目录
        fn=
        for i in $@
        do
                is_dir $i
        done

        filename=`echo $fn | tr ' ' ','`

        curl -s -u $USER:$PASSWD -T "{$filename}"  "$WEBDEV/file-hub/" -o /dev/null
}
main $@
# download
main(){
        if [ "$argv"x == "0"x ]
        then
                        usage;
                        exit 0
        fi

        # 上传目录
        fn=
        for i in $@
        do
                is_dir $i
        done

        filename=`echo $fn | tr ' ' ','`

        curl -O -u $USER:$PASSWD "$WEBDEV/file-hub/$filename"
}
# delete.sh
main(){
        if [ "$argv"x == "0"x ]
        then
                        usage;
                        exit 0
        fi

        # 上传目录
        fn=
        for i in $@
        do
                is_dir $i
        done

        filename=`echo $fn | tr ' ' ','`


        curl -X DELETE -u $USER:$PASSWD "$WEBDEV/file-hub/$filename"
}
上面脚本完成了基本功能,但是很多边界并没有考虑,大家在自己实现的时候可以考虑更全面一点
四、定期整理文件
我们作为中转站,需要每天按照日期归档文档,脚本如下:
#!/bin/bash

FILE_HUB_DIR="/root/owner-workspace/file-hub"
cd ${FILE_HUB_DIR}
DATE=`date +%Y-%m-%d`

[ -d ${DATE} ] && mv ${DATE} "${DATE}_bak"
mkdir ${DATE}

for file in $(ls ${FILE_HUB_DIR})
do
        [ -d ${file} ] && continue
        mv ${file} ${DATE}/
done

COUNT=`ls ${DATE} | wc -l`
if [ "${COUNT}"x == "0"x ]
then
        alias rmdir=rmdir
        rmdir ${DATE}
fi
脚本临时写出来,逻辑比较简单,为了让其能够正常的按天运行,如下配置crontab
crontab -e
0 1 * * * /usr/local/bin/organize_files.sh
五、简单的提示界面
根据上面的操作,我们已经完成了中转站的基本功能,为了让别人登录服务器的时候,更清楚我们登录了中转站,所以我们需要编写一个index.html,如下
vim /var/www/html/index.html
<!DOCTYPE html>
<html lang="en">
<head>
    <meta charset="UTF-8">
    <meta name="viewport" content="width=device-width, initial-scale=1.0">
    <title>File Hub</title>
    <style>
        body {
            font-family: Arial, sans-serif;
            background-color: #f4f4f4;
            margin: 0;
            padding: 0;
            display: flex;
            justify-content: center;
            align-items: center;
            height: 100vh;
        }
        .container {
            background-color: white;
            padding: 20px;
            border-radius: 8px;
            box-shadow: 0 0 10px rgba(0, 0, 0, 0.1);
            text-align: center;
        }
        a {
            text-decoration: none;
            color: #007BFF;
        }
        a:hover {
            text-decoration: underline;
        }
    </style>
</head>
<body>
    <div class="container">
        <h1>欢迎使用麒麟文件中转站</h1>
        <p>请登录到 <a href="http://172.25.130.31/file-hub">http://172.25.130.31/file-hub</a> 查看当前中转站内容.</p>
    </div>
</body>
</html>
此时页面如下:

至此,我们完成了一个文件中转站的基本功能。欢迎大家使用
了解到大家对于程序如何启动抱有极大的兴趣,尽管我们了解elf的组成原理,但是和程序的启动还是不太一致的,本文通过一个最简单的程序,来浅析一下一个程序的启动过程。便于大家更加深入的了解linux中一个程序的启动过程
一、最简单的C程序举例
我们在聊到C程序的时候,我相信所有人都或多或少了解过谭浩强的C语言书籍,我以第一节为例,如下:
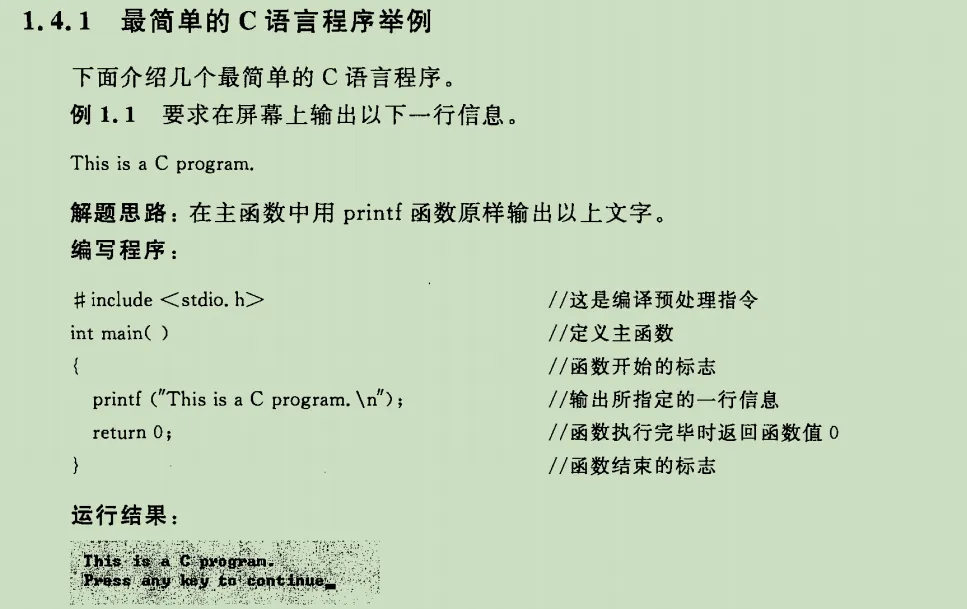
其中的代码内容如下:
#include <stdio.h>

int main()
{
        printf("This is a C program.\n");
        return 0;
}
我们编译后运行如下:
# gcc first_c.c -g -o c && ./c
This is a C program.
二、探究程序的调用过程
2.1 谁调用的main
根据上面的代码,我们获取了第一个c程序,我们./c就能运行。但是这里还远远不够,我们压根还不知道这个程序是如何被运行的。所以我们需要开始调试它
# gdb ./c
Reading symbols from ./c...
(gdb)
我们先断点在main上然后运行
(gdb) b main
Breakpoint 1 at 0x40059c: file first_c.c, line 5.
(gdb) r
Starting program: /root/c/c
[Thread debugging using libthread_db enabled]
Using host libthread_db library "/lib/aarch64-linux-gnu/libthread_db.so.1".
Breakpoint 1, main () at first_c.c:5
5 printf("This is a C program.\n");
此时我们查看一下x30寄存器,这是arm的lr寄存器,保存函数返回地址的
(gdb) x $x30
0x7ff7e3bd90 <__libc_start_main+232>: 0x940055c8
这里gdb友善的提供了提示__libc_start_main+232,我们可以发现是在__libc_start_main的sp指针的+232的位置,根据这个信息,我们拿到了main的上一个调用函数__libc_start_main
2.2 谁调用的__libc_start_main
此时我们将断点放在__libc_start_main上,重新运行,如下:
(gdb) b __libc_start_main
Breakpoint 2 at 0x7ff7e3bca8: file ../csu/libc-start.c, line 141.
(gdb) d 1
(gdb) r
The program being debugged has been started already.
Start it from the beginning? (y or n) y
Starting program: /root/c/c
[Thread debugging using libthread_db enabled]
Using host libthread_db library "/lib/aarch64-linux-gnu/libthread_db.so.1".
Breakpoint 2, __libc_start_main (main=0x4004d8 <__wrap_main>, argc=1, argv=0x7ffffff1d8, init=0x4005b8 <__libc_csu_init>, fini=0x400638 <__libc_csu_fini>, rtld_fini=0x7ff7fdac90,
 stack_end=0x7ffffff1d0) at ../csu/libc-start.c:141
141 ../csu/libc-start.c: 没有那个文件或目录.
然后我们继续查看x30的值
(gdb) x $x30
0x4004d4 <_start+52>: 0x97ffffeb
这里可以发现是_start函数调用了__libc_start_main
2.3 谁调用了_start
我们继续跟踪,如下:
(gdb) b _start
Breakpoint 3 at 0x4004ac
(gdb) d 2
(gdb) r
The program being debugged has been started already.
Start it from the beginning? (y or n) y
Starting program: /root/c/c
[Thread debugging using libthread_db enabled]
Using host libthread_db library "/lib/aarch64-linux-gnu/libthread_db.so.1".
Breakpoint 3, 0x00000000004004ac in _start ()
此时我们查看x30,发现了一个现象如下:
(gdb) x $x30
0x0: Cannot access memory at address 0x0
这里可以发现,_start没有满足调用约定了。
对于一个函数,如果不遵守调用约定了,那么我们可以知道,这个函数一定是第一个执行的函数,没有比它更早的函数调用。
我们可以通过readelf能够看到,如下:
# readelf -h c
ELF 头:
 Magic: 7f 45 4c 46 02 01 01 00 00 00 00 00 00 00 00 00
 类别: ELF64
 数据: 2 补码,小端序 (little endian)
 Version: 1 (current)
 OS/ABI: UNIX - System V
 ABI 版本: 0
 类型: EXEC (可执行文件)
 系统架构: AArch64
 版本: 0x1
 入口点地址: 0x4004ac
 程序头起点: 64 (bytes into file)
 Start of section headers: 7256 (bytes into file)
 标志: 0x0
 Size of this header: 64 (bytes)
 Size of program headers: 56 (bytes)
 Number of program headers: 9
 Size of section headers: 64 (bytes)
 Number of section headers: 29
 Section header string table index: 28
这里我们看到入口点地址是:0x4004ac
可以发现,我们的elf文件c程序,默认的ld的入口地址是0x4004ac,这个地址就是_start函数。这个_start函数最终会调用到main上。
三、程序启动后做了哪些事
3.1 _start函数做的事
根据上面我们知道,程序第一个函数入口是_start,我们可以对这个函数反汇编,如下:
(gdb) disassemble
Dump of assembler code for function _start:
 0x00000000004004a0 <+0>: mov x29, #0x0 // #0
 0x00000000004004a4 <+4>: mov x30, #0x0 // #0
 0x00000000004004a8 <+8>: mov x5, x0
=> 0x00000000004004ac <+12>: ldr x1, [sp]
 0x00000000004004b0 <+16>: add x2, sp, #0x8
 0x00000000004004b4 <+20>: mov x6, sp
 0x00000000004004b8 <+24>: adrp x0, 0x400000
 0x00000000004004bc <+28>: add x0, x0, #0x4d8
 0x00000000004004c0 <+32>: adrp x3, 0x400000
 0x00000000004004c4 <+36>: add x3, x3, #0x5b8
 0x00000000004004c8 <+40>: adrp x4, 0x400000
 0x00000000004004cc <+44>: add x4, x4, #0x638
 0x00000000004004d0 <+48>: bl 0x400460 <__libc_start_main@plt>
 0x00000000004004d4 <+52>: bl 0x400480 <abort@plt>
End of assembler dump.
可以发现,这里默认设置x29和x30为0,然后跳转到0x400460 <__libc_start_main@plt>上,我们随机跟到代码中,如下:
这里以glibc-2.31为例,glibc-2.31/sysdeps/aarch64/start.S这里_start函数如下
        .text
        .globl _start
        .type _start,#function
_start:
        /* Create an initial frame with 0 LR and FP */
        mov     x29, #0
        mov     x30, #0

        /* Setup rtld_fini in argument register */
        mov     x5, x0

        /* Load argc and a pointer to argv */
        ldr     PTR_REG (1), [sp, #0]
        add     x2, sp, #PTR_SIZE

        /* Setup stack limit in argument register */
        mov     x6, sp

#ifdef PIC
# ifdef SHARED
        adrp    x0, :got:main
        ldr     PTR_REG (0), [x0, #:got_lo12:main]

        adrp    x3, :got:__libc_csu_init
        ldr     PTR_REG (3), [x3, #:got_lo12:__libc_csu_init]

        adrp    x4, :got:__libc_csu_fini
        ldr     PTR_REG (4), [x4, #:got_lo12:__libc_csu_fini]
# else
        adrp    x0, __wrap_main
        add     x0, x0, :lo12:__wrap_main
        adrp    x3, __libc_csu_init
        add     x3, x3, :lo12:__libc_csu_init
        adrp    x4, __libc_csu_fini
        add     x4, x4, :lo12:__libc_csu_fini
# endif
#else
        /* Set up the other arguments in registers */
        MOVL (0, main)
        MOVL (3, __libc_csu_init)
        MOVL (4, __libc_csu_fini)
#endif

        /* __libc_start_main (main, argc, argv, init, fini, rtld_fini,
                              stack_end) */

        /* Let the libc call main and exit with its return code.  */
        bl      __libc_start_main

        /* should never get here....*/
        bl      abort

#if defined PIC && !defined SHARED
        /* When main is not defined in the executable but in a shared library
           then a wrapper is needed in crt1.o of the static-pie enabled libc,
           because crt1.o and rcrt1.o share code and the later must avoid the
           use of GOT relocations before __libc_start_main is called.  */
__wrap_main:
        b       main
#endif

        /* Define a symbol for the first piece of initialized data.  */
        .data
        .globl __data_start
__data_start:
        .long 0
        .weak data_start
        data_start = __data_start
这里很明显做了如下:
- 初始化LR和FP寄存器
- 将第一个参数rtld_fini给到x4
- 将参数加载到$sp
- 跳转到__libc_start_main
3.2 __libc_start_main函数做的事
我们可以翻阅glibc的代码,在csu/libc-start.c有函数的定义,如下:
#ifdef LIBC_START_MAIN
# ifdef LIBC_START_DISABLE_INLINE
#  define STATIC static
# else
#  define STATIC static inline __attribute__ ((always_inline))
# endif
#else
# define STATIC
# define LIBC_START_MAIN __libc_start_main
#endif

STATIC int
LIBC_START_MAIN (int (*main) (int, char **, char ** MAIN_AUXVEC_DECL),
                 int argc, char **argv,
#ifdef LIBC_START_MAIN_AUXVEC_ARG
                 ElfW(auxv_t) *auxvec,
#endif
                 __typeof (main) init,
                 void (*fini) (void),
                 void (*rtld_fini) (void), void *stack_end)
{
    ........
    exit (result);
}
这里我们留意参数可以知道需要调用如下:
 __typeof (main) init
void (*fini) (void)
void (*rtld_fini) (void), void *stack_end)
exit (result);
这里可以知道,__libc_start_main会调用.init,.fini ,mian和exit以及rtld_fini。
这里.init 和.fini 是用作代码运行时构造和析构的默认回调接口
这里rtld_fini 是ld的清理函数。接下来注意解析:
3.2.1 rtld_fini
此函数是x5寄存器
(gdb) x $x5
0x7ff7fdac90: 0xa9b87bfd
我们可以gdb内部设置断点如下:
(gdb) b *0x7ff7fdac90
Breakpoint 4 at 0x7ff7fdac90
然后继续运行
(gdb) c
Continuing.
This is a C program.
Breakpoint 4, 0x0000007ff7fdac90 in ?? () from /lib/ld-linux-aarch64.so.1
可以发现程序正常运行推出后,会断点停在/lib/ld-linux-aarch64.so.1内部。
但是我们进行反汇编却看不到代码调用,说明实际上是一个栈区地址而已,并不是完整的函数
(gdb) disassemble
No function contains program counter for selected frame.
3.2.2 init
我们知道.init函数是x3,所以可以根据如下汇编计算
 0x00000000004004c0 <+32>: adrp x3, 0x400000
 0x00000000004004c4 <+36>: add x3, x3, #0x5b8
我们加上断点后运行如下:
(gdb) b *0x4005b8
Breakpoint 5 at 0x4005b8
(gdb) c
Continuing.
Breakpoint 5, 0x00000000004005b8 in __libc_csu_init ()
可以发现函数是__libc_csu_init,我们反汇编
(gdb) disassemble
Dump of assembler code for function __libc_csu_init:
=> 0x00000000004005b8 <+0>: stp x29, x30, [sp, #-64]!
 0x00000000004005bc <+4>: mov x29, sp
 0x00000000004005c0 <+8>: stp x19, x20, [sp, #16]
 0x00000000004005c4 <+12>: adrp x20, 0x410000
 0x00000000004005c8 <+16>: add x20, x20, #0xdf0
 0x00000000004005cc <+20>: stp x21, x22, [sp, #32]
 0x00000000004005d0 <+24>: adrp x21, 0x410000
 0x00000000004005d4 <+28>: add x21, x21, #0xde8
 0x00000000004005d8 <+32>: sub x20, x20, x21
 0x00000000004005dc <+36>: mov w22, w0
 0x00000000004005e0 <+40>: stp x23, x24, [sp, #48]
 0x00000000004005e4 <+44>: mov x23, x1
 0x00000000004005e8 <+48>: mov x24, x2
 0x00000000004005ec <+52>: bl 0x400420 <_init>
 0x00000000004005f0 <+56>: cmp xzr, x20, asr #3
 0x00000000004005f4 <+60>: b.eq 0x400620 <__libc_csu_init+104> // b.none
 0x00000000004005f8 <+64>: asr x20, x20, #3
 0x00000000004005fc <+68>: mov x19, #0x0 // #0
 0x0000000000400600 <+72>: ldr x3, [x21, x19, lsl #3]
 0x0000000000400604 <+76>: mov x2, x24
 0x0000000000400608 <+80>: add x19, x19, #0x1
 0x000000000040060c <+84>: mov x1, x23
 0x0000000000400610 <+88>: mov w0, w22
 0x0000000000400614 <+92>: blr x3
 0x0000000000400618 <+96>: cmp x20, x19
 0x000000000040061c <+100>: b.ne 0x400600 <__libc_csu_init+72> // b.any
 0x0000000000400620 <+104>: ldp x19, x20, [sp, #16]
 0x0000000000400624 <+108>: ldp x21, x22, [sp, #32]
 0x0000000000400628 <+112>: ldp x23, x24, [sp, #48]
 0x000000000040062c <+116>: ldp x29, x30, [sp], #64
 0x0000000000400630 <+120>: ret
End of assembler dump.
这里可以看到会跳转到_init函数,我们继续断点
(gdb) b *_init
Breakpoint 6 at 0x7ff7e3bc08: file init-first.c, line 55.
运行如下:
(gdb) r
Starting program: /root/c/c
[Thread debugging using libthread_db enabled]
Using host libthread_db library "/lib/aarch64-linux-gnu/libthread_db.so.1".
Breakpoint 6, _init (argc=1, argv=0x7ffffff1d8, envp=0x7ffffff1e8) at init-first.c:55
55 init-first.c: 没有那个文件或目录.
此时进入_init函数内部
(gdb) c
Continuing.
Breakpoint 18, 0x0000000000400420 in _init ()
(gdb) disassemble
Dump of assembler code for function _init:
=> 0x0000000000400420 <+0>: stp x29, x30, [sp, #-16]!
 0x0000000000400424 <+4>: mov x29, sp
 0x0000000000400428 <+8>: bl 0x4004dc <call_weak_fn>
 0x000000000040042c <+12>: ldp x29, x30, [sp], #16
 0x0000000000400430 <+16>: ret
End of assembler dump.
可以发现,其就是运行的默认的init回调,我们可以objdump查看如下:
objdump -d c.o
Disassembly of section .init:
0000000000400420 <_init>:
 400420: a9bf7bfd stp x29, x30, [sp, #-16]!
 400424: 910003fd mov x29, sp
 400428: 9400002d bl 4004dc <call_weak_fn>
 40042c: a8c17bfd ldp x29, x30, [sp], #16
 400430: d65f03c0 ret
3.2.3 fini
我们知道fini是保存在x4,所以如下:
 0x00000000004004c8 <+40>: adrp x4, 0x400000
 0x00000000004004cc <+44>: add x4, x4, #0x638
此时我们计算出函数如下:
(gdb) x 0x400638
0x400638 <__libc_csu_fini>: 0xd65f03c0
我们直接反汇编如下:
(gdb) disassemble __libc_csu_fini
Dump of assembler code for function __libc_csu_fini:
 0x0000000000400638 <+0>: ret
End of assembler dump.
可以看到此函数直接是一个返回
我们通过objdump如下:
Disassembly of section .fini:
000000000040063c <_fini>:
 40063c: a9bf7bfd stp x29, x30, [sp, #-16]!
 400640: 910003fd mov x29, sp
 400644: a8c17bfd ldp x29, x30, [sp], #16
 400648: d65f03c0 ret
可以发现一致。
3.2.4 main
我们知道main函数是__libc_start_main中直接调用的我们反汇编后,注意这个语句
 0x0000007ff7e3bd88 <+224>: ldr x3, [sp, #104]
 0x0000007ff7e3bd8c <+228>: blr x3
代码运行如下:
(gdb) b *0x0000007ff7e3bd8c
Breakpoint 31 at 0x7ff7e3bd8c: file ../csu/libc-start.c, line 308.
(gdb) c
Continuing.
Breakpoint 31, 0x0000007ff7e3bd8c in __libc_start_main (main=0x4004d8 <__wrap_main>, argc=1, argv=0x7ffffff1d8, init=<optimized out>, fini=<optimized out>, rtld_fini=<optimized out>,
 stack_end=<optimized out>) at ../csu/libc-start.c:308
308 in ../csu/libc-start.c
可以发现其跳转了x3,然后以0x0000007ff7e3bd90作为lr,我们计算sp+104的值,如下:
(gdb) x $sp+104
0x7ffffff0e8: 0x004004d8
可以发现blr会跳转到0x004004d8,我们解释这个地址
(gdb) x 0x004004d8
0x4004d8 <__wrap_main>: 0x1400002f
然后打上断点
(gdb) b *0x004004d8
Breakpoint 1 at 0x4004d8
(gdb) r
Breakpoint 1, 0x00000000004004d8 in __wrap_main ()
然后反汇编
(gdb) disassemble
Dump of assembler code for function __wrap_main:
=> 0x00000000004004d8 <+0>: b 0x400594 <main>
End of assembler dump.
这里会直接跳转到mian,我们继续运行
(gdb) r
Breakpoint 3, 0x0000000000400594 in main ()
然后再反汇编main函数,如下
(gdb) disassemble
Dump of assembler code for function main:
=> 0x0000000000400594 <+0>: stp x29, x30, [sp, #-16]!
 0x0000000000400598 <+4>: mov x29, sp
 0x000000000040059c <+8>: adrp x0, 0x400000
 0x00000000004005a0 <+12>: add x0, x0, #0x668
 0x00000000004005a4 <+16>: bl 0x400490 <puts@plt>
 0x00000000004005a8 <+20>: mov w0, #0x0 // #0
 0x00000000004005ac <+24>: ldp x29, x30, [sp], #16
 0x00000000004005b0 <+28>: ret
End of assembler dump.
然后我们将c程序直接objdump,如下
0000000000400594 <main>:
 400594: a9bf7bfd stp x29, x30, [sp, #-16]!
 400598: 910003fd mov x29, sp
 40059c: 90000000 adrp x0, 400000 <_init-0x420>
 4005a0: 9119a000 add x0, x0, #0x668
 4005a4: 97ffffbb bl 400490 <puts@plt>
 4005a8: 52800000 mov w0, #0x0 // #0
 4005ac: a8c17bfd ldp x29, x30, [sp], #16
 4005b0: d65f03c0 ret
 4005b4: d503201f nop
可以发现是完全一样的。这里我们正常跟踪到了main函数
四、总结
通过此程序,我们可以知道一个程序的启动过程,从elf作为开始,ld加载了entrypoint后,是通过启动了_start的text label后,然后再逐渐调用到main函数的。
相当于从程序的最开头,进行了简单的了解了一个程序的启动过程。
随着人员逐渐多,并且处理的事情越来越多,导致服务经常出现io占用高,cpu占用高,内存占用高三种情况。本文通过crontab的方式定时进行查询和设置,来实现定期对服务的资源限制,从而确保服务不会突然卡死的情况出现
一、问题描述
在一个服务器上,多人进行编辑,编译时,通常情况下,编译的时候会把cpu,memery,io占满,三者只要有其一出现满负载,则打开的vim程序会出现,卡顿,杀掉,卡死。
对于cpu满负载而言,通常是vim程序得不到该有的调度,主要原因是vim的PRI和NI是80和0,而常规程序的优先级也是80和0,此时vim程序卡顿
对于memory满负载而言,通常是系统内存不足时,不得已情况下,通过out_of_memory函数选择一个oom score最低的程序进行杀掉,vim通常会是得分较低的进程。主要原因是vim的score是0,而常规程序的score也是0。此时vim可能被杀死
对于io负载而言,通常是io状态是陷入并且阻塞的,如果io负载高,则短时间内所有进程无法都被block住,无法被调度,此时vim出现卡死
所以,为了解决编译和编辑时的服务器负载问题,需要通过一个脚本来实现对cpu,io,memory的控制,从而使得编辑程序vim得到该有的调度,而编译程序也能正常运行。
二、工具
为了实现上述的功能,需要借助cpulimit,cgroup, ionice三个工具
2.1 cpulimit
cpulimit是一个限制cpu使用率的工具,我们可以通过-p参数指定进程的pid,通过-l参数设置使用率百分比,从而限制进程使用率。介绍如下:
-p, --pid=N        pid of the process
-l, --limit=N percentage of cpu allowed from 1 up.
 Usually 1 - 4800, but can be higher
 on multi-core CPUs (mandatory)
所以,对于cpu满负载的情况,通过cpulimit限制当前最高使用率的进程,从而对突出的程序进行有效控制。让系统有办法调度到其他的程序
2.2 cgroup
cgroup是用作资源管理的内核框架,它作为文件系统存放于linux系统中,我们可以通过cgroup设置某个进程的内存使用情况,具体如下:
/sys/fs/cgroup/memory/kylin_limit/memory.limit_in_bytes
所以,对于io满负载的情况,通过cgroups设置memory.limit_in_bytes来限制高占用进程的内存占用率,从而对高内存占用程序进行有效控制,让系统其他进程能够正常申请到内存。
不过值得注意的是,对于进程的内存使用限制可能导致进程运行失败,所以通常我们在服务器上设置单个进程使用不超过总内存的10%,通常服务器的总内存为64G,则单个进程使用内存不应该超过6.4G。通常来说,单个进程的内存使用量如果超过6.4G已经存在异常。所以没有问题。
但是如果是小内存的设备,通过memory.limit_in_bytes来限制指定进程的内存使用率并不可取,假设在内存4G的机器上,我们限制进程的内存使用率仍是10%,则单个进程使用内存不超过400M,又由于很多程序可能使用内存大于400M(属于正常现象),这会导致进程的oom,所以我们应该做的是通过增大swap来将内存压力转换为io压力。
通过swap来转换内存压力为io压力的方法如下:
mkswap /dev/sda1
swapon /dev/sda1
如果我们不是真实的设备,可以将swap开启在img文件上,如下
dd if=/dev/zero of=/tmp/swap bs=512 count=20480000
mkswap /tmp/swap
swapon /tmp/swap
2.3 ionice
ionice是用作调整进程的io优先级的命令,通过ionice命令,可以设置指定进程作为实时的io调度,从而加速系统对某些进程的io行为。主要如下:
ionice -c 2 -n 7 -p ${pid}  # 设置pid进程的调度为尽力,并优先级设置为7
ionice -c 1 -p ${pid}                   # 设置pid进程的调度为实时
这里-c可以设置优先级,-n设置优先级,-p设置pid,介绍如下
用法:
 ionice [选项] -p <pid>...
 ionice [选项] -P <pgid>...
 ionice [选项] -u <uid>...
 ionice [选项] <命令>
设置或更改进程的 IO 调度类别和优先级。
选项:
 -c, --class <类别> 调度类别的名称或数值
 0: 无, 1: 实时, 2: 尽力, 3: 空闲
 -n, --classdata <数字> 指定调度类别的优先级(0..7),只针对
 “实时”和“尽力”类别
 -p, --pid <pid>... 对这些已运行的进程操作
 -P, --pgid <pgrp>... 对这些组中已运行的进程操作
 -t, --ignore 忽略失败
 -u, --uid <uid>... 对属于这些用户的已运行进程操作
-h, --help 显示此帮助
 -V, --version 显示版本
所以,对于满io负载的情况,可以通过ionice命令对io刷盘进程如flush进行实时调度,对io使用率高的程序使用优先级最低为7的尽力调度,从而可以使得vim的写操作可以正常的flush,并且可能从普通进程上抢到io的调度。
三、具体操作
根据上述的介绍,我们可以通过三个工具完成对应的功能,现在介绍如何实施
3.1 限制最高cpu占用率的进程
为了限制高占用的进程,我们需要在系统长时间占用高的情况下找到占用高的进程,因为某些短时进程会占用很高(例如top后一直按enter来一直刷新),这些我们应该忽略。所以需要先获取平均负载,如下:
load=`cat /proc/loadavg | cut -f1 -d' '`
上面可以获取1分钟内的平均负载,如果平均负载大于100,则认为1分钟内,进程占用高,可能在后台执行编译动作
declare -i loadavg=`echo "${load} * 100" | bc | awk -F. '{print $1}'`
 if (( ${loadavg} >= ${LOAD_CPU_THRESHOLD} ))
此时我们可以通过ps命令找出最高占用的那个进程
high_exe=`ps -eo user,pid,pcpu,pmem,args --sort=-pcpu |sed -n 2p | xargs`
根据ps的结果,可以获取进程的pid和name,如下
pid=`echo ${high_exe} | awk '{print $2}'`
pid_name=`echo ${high_exe} | awk '{print $5}'`
根据pid值,我们可以知道是谁连接的ssh客户端,找到ip如下
who=`cat /proc/${pid}/environ | tr '\0' '\n' | grep SSH_CONNECTION | cut -d= -f2 | awk '{print $1":" $2}'`
同时通过cpulimit设置此进程的占用率不超过100%
cpulimit -p ${pid} -l 100 > /dev/null 2>&1 &
至此,如果crontab每一10分钟轮询一次,系统将查询最近1分钟内是否负载高,如果负载高,则找出当前占用最高的进程,设置其占用率不超过100%
3.2 限制程序使用最高内存
为了限制高内存占用的程序,我们需要在系统剩余内存不足时找出内存占用最高的进程,然后将其设置为总内存的10%,从而让其他程序有可能申请到内存。
基于此思路,我们需要判断当前内存剩余量,如下
declare -i free=`free -m | sed -n 2p | xargs | cut -f7 -d' '`
上面可以获取到剩余内存,当然,同样通过free命令,我们也可以获取到总共内存,我们需要判断一下剩余内存是否小于总共内存的比例即可,具体比例可以自行设置,建议10%
如果剩余内存小于总共内存的10%,我们需要找到高内存的进程,如下
high_mem_exe=`ps -eo pid,pcpu,pmem,args --sort=-pmem |sed -n 2p | xargs`
同样的,通过上面可以知道高内存占用进程的pid和name,以及谁ssh登录的,如下
pid=`echo ${high_mem_exe} | awk '{print $1}'`
pid_name=`echo ${high_mem_exe} | awk '{print $4}'`
who=`cat /proc/${pid}/environ | tr '\0' '\n' | grep SSH_CONNECTION | cut -d= -f2 | awk '{print $1":" $2}'`
我们知道pid之后,便可以通过cgroup设置进程的最大内存使用量
[ ! -d /sys/fs/cgroup/memory/kylin_limit ] && mkdir /sys/fs/cgroup/memory/kylin_limit
 echo ${pid} > /sys/fs/cgroup/memory/kylin_limit/tasks
 echo $(expr $total \/ 10 \* 1024) > /sys/fs/cgroup/memory/kylin_limit/memory.limit_in_bytes
这里total是总内存大小,可以通过free命令获取,我们可以设置cgroup下的kylin_limit组的内存使用率不能超过总内存的10%
至此,如果crontab每10分钟轮询一次,系统将查询当前剩余内存,如果剩余内存不足总内存的某个比例,则可以通过cgroups设置最高内存占用率的进程其最大内存使用量不超过总内存的10%
3.3 限制程序io的政策
程序的io都是block的,因为谁也不知道陷入io处理需要多久时间,所以通常如果io存在瓶颈,大部分情况下都是cpu在等io,从而导致vim卡死的情况
通常来说,对于磁盘来说,刷盘是由内核线程[kworker/uxx:x+flush-x:xxx]实现,如果是文件系统write,也可能是mount进程中实现。本文只讨论常出现的flush
首先我们需要找到io占用率高的进程,如下
io_message=`iotop -n 1 -b -o | grep -v WRITE | xargs`
从上述的信息获取到io占用率和pid以及name
 percent=`echo ${io_message} | awk '{print $10}'`
 name=`echo ${io_message} | awk '{print $12}'`
 pid=`echo ${io_message} | awk '{print $1}'`
如果进程是flush,则当前io压力最大的是刷盘线程
if [[ ${pid_name} =~ "kworker" ]]
 then
 if [[ ${pid_name} =~ "flush" ]]
 then
此时我们可以通过ionice命令设置flush线程为实时io调度,如下
ionice -c 1 -p ${pid}
如果io占用率超过99%了,则说明有io占用很高的进程,如下
echo ${percent} | egrep "^99.**" > /dev/null
此时我们可以将此进程设置为尽力,优先级放最低为7,此时程序能够正常跑即可,相当于以时间换内存空间
ionice -c 2 -n 7 -p ${pid}
至此,如果crontab每10分钟轮询一次,系统将找到io占用高的进程,先判断是否为flush,如果是flush则调整为实时,如果不是,则是其他进程io占用高,此时将其他进程调整为尽力,优先级最低为7
当然,如果io密集型的任务多,我们可以让其1分钟运行一次,在不改变crontab的前提下,可以做个循环如下:
for((i=0;i<10;i++)); do
 io_policy
 ret=$?
 if [ "${ret}"x == "1" ]
 then
 sleep 60
 fi
done
3.4 crontab定时
对于上述的策略,我们可以10分钟运行一次,首先将其脚本命名为kylin-server-status.sh,通过crontab -e编写如下:
*/10 * * * * /usr/local/bin/kylin-server-status.sh
至此,服务器会每10分钟轮询一次